
StageTools User Manual
Manual version: 0.1 draft App version: v1.0 launch draft Date: May 25, 2026 Owner: Jonathan Huggins Status: Working draft
StageTools is a lighting toolkit for iPhone and iPad. It keeps the tools a working lighting tech reaches for during prep, scouting, troubleshooting, and quick documentation in one place: Quick Plots, Scout Notes, Files, Fixture Library, Network Devices, DMX Viewer, Micro Console, Protocol Detector, LTC Timecode, Curve Builder, Color Science Calculator, DIP Switch Calculator, and NDI Monitor.
This manual is written for working lighting professionals. It assumes you already know the job. It focuses on where things are in StageTools, what each tool does, and the shortest reliable path through common workflows.
Chapter 1How to Use This Manual
Use this manual when you need a complete reference. Use the in-app Help screen when you need a quick answer while you are already working.
Each feature chapter follows the same structure:
- What the tool is for.
- Where to open it.
- The main workflow.
- Important controls.
- Export, sharing, or sync behavior.
- Common issues to check before blaming the app.
Screenshots are tracked separately in Screenshot_Shot_List.md.
Chapter 2Quick Start
2.1The Main Areas
StageTools has five main areas:
- ToolBox(
 ) — network, DMX, timecode, calibration, and utility tools.
 - Quick Plots(
 ) — lighting plots and network/power topology layouts.
 - Fixtures(
 ) — GDTF Share Library search, downloads, favorites, and offline fixture reference.
 - Files(
 ) — saved links, PDFs, manuals, plots, documents, folders, QR/NFC sharing, and file previews.
 - Scout Notes(
 ) — location scouts with photos, notes, voice memos, files, map snapshots, and PDF export.
On iPhone, these live in the bottom tab bar. On iPad, the same areas live in the sidebar when there is enough room.
2.2Home
Home is the front door. It shows:
- Shortcuts for common actions.
- Recent plots, files, scouts, and showfiles.
- Website and Instagram links.
- Help and Settings.(
 )
) - iCloud Sync status.(
 )
)
Tap the StageTools logo from a root tab to return Home.
2.3Settings
Open Settings from the gear on Home.
Settings includes:
- Subscription and trial status.
- GDTF Share sign-in.
- iCloud Sync.
- Haptics and appearance.
- Plot defaults.
- Ping monitor defaults.
- PDF branding.
- Diagnostics and support.
If something is not syncing, downloading, scanning, or exporting the way you expect, Settings is usually the first place to check.
2.4iCloud Sync
iCloud Sync keeps supported StageTools data available across devices signed into the same iCloud account.
StageTools can sync Quick Plots, saved scans, Scout folders and metadata, Scout media references, Curve Builder profiles, ToolBox layout, Home shortcuts, and many preferences.
Large Scout media may appear on a second device as a cloud-backed item before the full file downloads. Open the Scout and pull the media down when you need it locally.
2.5Offline Use
Many StageTools workflows work offline:
- Quick Plots.
- Files already saved on the device.
- Scout Notes.
- DIP Switch Calculator.
- Color Science Calculator.
- Curve Builder setup and export.
- Downloaded fixtures.
- Custom symbols.
Live network tools need a connection to the show network. That includes Network Devices scans, DMX Viewer, Micro Console transmit, Protocol Detector, NDI, LTC audio I/O, and ping monitoring.
Chapter 3ToolBox Overview
ToolBox is the hub for the utility side of StageTools.
Current v1.0 ToolBox tools:
| Tool | Use It For |
|---|---|
| Network Devices( | Scanning devices, saving scan profiles, mapping device layouts, and monitoring pings. |
| DMX Viewer( | Listening to sACN and ArtNet, inspecting universes, and finding channel changes. |
| Micro Console( | Patching fixtures, running faders/programmer controls, and transmitting sACN or ArtNet when needed. |
| DIP Switch Calculator( | Converting DMX addresses to switch positions and back. |
| Color Science Calculator( | Converting CCT/tint values, building measured fixture profiles, and solving CIE targets. |
| Protocol Detector( | Passively sniffing common show-network protocols and sources. |
| LTC Timecode( | Generating or receiving SMPTE LTC over audio. |
| Curve Builder( | Building fixture correction curves from meter readings and exporting references. |
| NDI Monitor( | Discovering and previewing NDI video sources on the network. |
Micro Console can transmit. Read the transmit confirmation. It tells you what your output will do based on protocol and priority.
Chapter 4Quick Plots
4.1What Quick Plots Is For
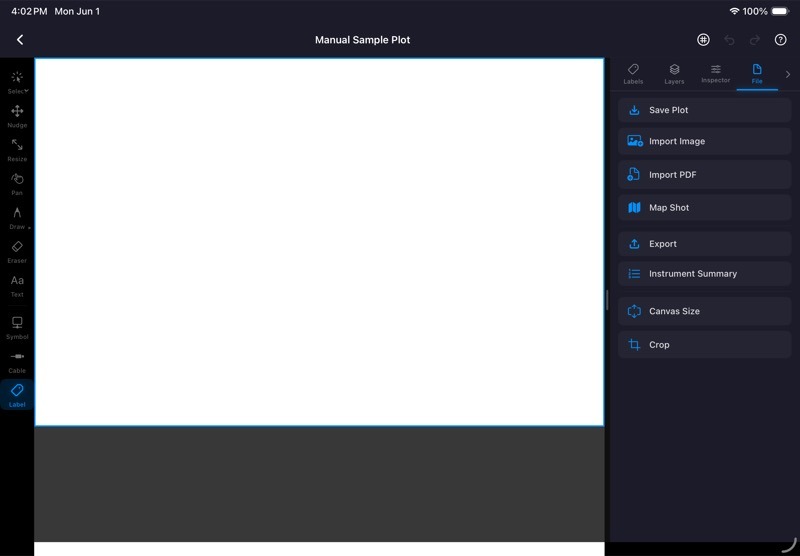
Quick Plots is for fast lighting plots and network/power layouts. It is not trying to replace a full drafting package. Use it when you need a clean working reference: fixtures on a scout photo, a small rig sketch, a network topology, a cable plan, or a PDF/PNG you can send to the crew.(![]() )
)
A Quick Plot can hold multiple kinds of work on the same canvas:
- Lighting symbols and labels.
- Network and power symbols.
- Cables.
- Text and drawn notes.
- Background images, PDFs, or map shots.
- Layers.
Quick Plots is one canvas. Symbols and labels are separated by type inside their panels: Lighting, Network/Power, and Grip. That keeps the tool choices focused without splitting the plot into separate modes.
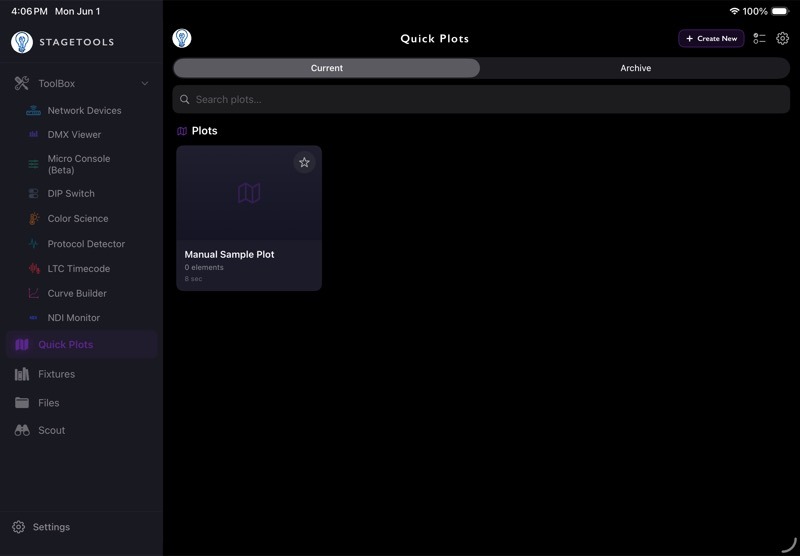
4.2Open Quick Plots
Open the Quick Plots tab.
The list shows current plots. Archived plots stay out of the main list and Home Recents.
From the list you can:
- Open an existing plot.
- Create a new plot.
- Search or browse saved plots.
- Archive or manage older plots.
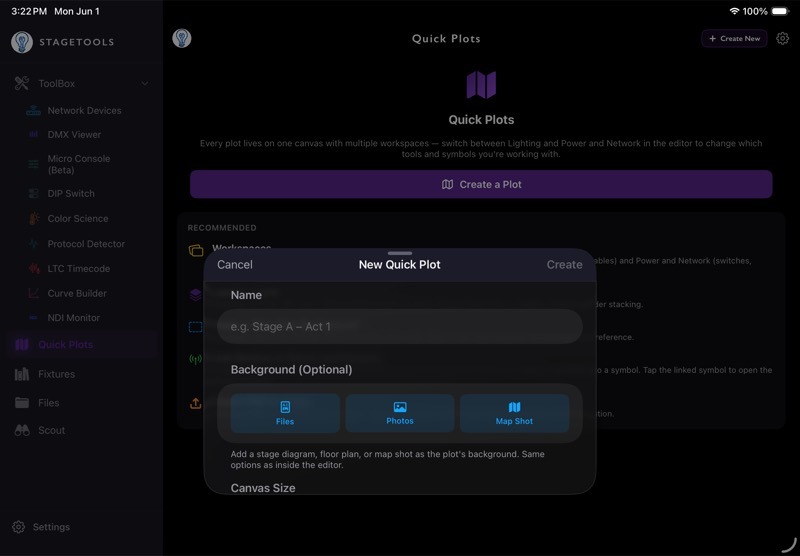
4.3Create a New Quick Plot
- Open Quick Plots.
- Tap the new plot button.
- Choose the starting plot setup.
- Name the plot.
- Set the paper/background options if needed.
- Open the plot.
Use names you will recognize later. A venue, stage, room, or setup name is better than a generic title.
4.4Canvas Navigation
Use these gestures in the editor:
| Gesture | Action |
|---|---|
| Pinch | Zoom in or out. |
| Two-finger drag | Pan the canvas. |
| Single-finger drag on empty canvas | Depends on the active tool; Select can box-select. |
| Tap empty canvas | Deselects the current item in Select. |
| Tap an item | Selects it if it is editable on the active layer. |
Quick Plots intentionally protects layers. Most objects can only be selected when their layer is active. Cables are the exception because network and power cable workflows need to stay reachable across their assigned layers.
4.5Symbol and Label Types
Quick Plots uses type filters inside the Symbol and Label panels.
| Type | Use It For |
|---|---|
| Lighting | Fixture symbols, fixture labels, DMX/address labels, lighting plot work. |
| Network/Power( | Switches, nodes, APs, distros, generators, power/network cables, labels from saved scans. |
| Grip | Reserved for a future expansion. |
(![]() )(
)(![]() )
)
Switch symbol or label type when you want to place different gear or adjust labels for that discipline.
4.6Quick Plots Tools
The Quick Plots editor is built around a small set of tools. On iPhone, the tools live in the bottom toolbar with contextual controls above it. On iPad, the tools sit in the side/tool panels with more room for the active controls.
| Tool | Use It For |
|---|---|
| Select | Select, move, box-select, duplicate, group, align, inspect, and edit existing items. |
| Symbols | Place lighting, Network/Power, Grip, built-in, GDTF-backed, and custom symbols. |
| Labels | Add fixture numbers, DMX/address labels, device labels, IP labels, notes, label positions, and label styling. |
| Cable | Draw cable runs between symbols or across the canvas. Use waypoints when the path needs bends. |
| Draw | Add freehand marks, lines, boxes, and circles directly on the plot. |
| Text | Add plain text notes that are not tied to a specific symbol. |
| Nudge | Move selected items in small steps when dragging is too coarse. Use it for lining up symbols, labels, and tight layouts. |
| Eraser | Remove drawings or plot items when the erase tool is active. |
| Layers | Show, hide, grey, lock, reorder, and adjust opacity for layers. |
| Inspector | Edit the selected item: size, rotation, color, labels, layer, lock state, and item-specific settings. |
| File / Export | Import backgrounds, manage paper/background settings, export PDF/PNG, save to Photos, or add exports to Files. |
(![]() )(
)(![]() )(
)(![]() )(
)(![]() )(
)(![]() )(
)(![]() )(
)(![]() )
)
Use Select when you are editing what already exists. Use Symbols, Labels, Cable, Draw, or Text when you are adding new information to the plot. Use Nudge when the item is close, but dragging keeps overshooting the spot.

4.7Add a Background
Backgrounds give a plot context. Use a floor plan, scout photo, PDF, saved Files item, or map image when you have one.
General workflow:(![]() )
)
- Open the plot.
- Open the file/background controls.
- Choose the source.
- Import the image or PDF.
- Fit the paper to the background or keep the existing paper size.
- Adjust opacity, scale, or rotation if needed.
Use background opacity when the image is useful but too visually loud. The drawing should stay easier to read than the reference image.

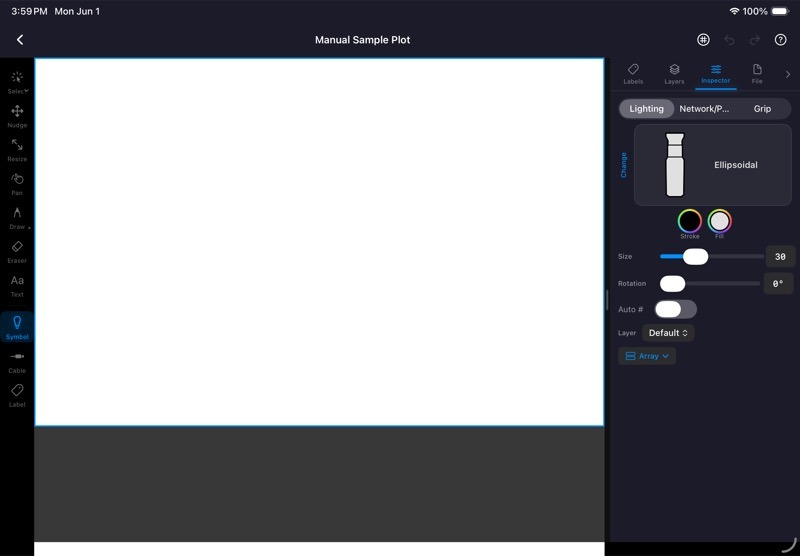
4.8Place Lighting Symbols
- Open Symbols.
- Choose the Lighting type.
- Choose a symbol category or fixture source.
- Tap the canvas to place the symbol.
- Drag to move it.
- Use the inspector or handles to resize, rotate, recolor, duplicate, or relabel it.
Lighting symbols can come from built-in generic symbols, downloaded GDTF fixtures, or custom symbols you imported or drew in StageTools.
4.9Use Custom Symbols
Custom Symbols lets you add your own reusable plot symbols when the built-in library does not cover the object you need.
You can create a custom symbol in two main ways:
- Importing PNG, JPG, HEIC, or SVG artwork.
- Drawing a symbol inside StageTools.
Use custom symbols for one-off fixtures, practicals, venue-specific gear, house equipment, network hardware, or any object you want available again on future plots.
Downloaded GDTF fixtures can also use custom or generic symbol overrides. When you change the symbol for a downloaded fixture, StageTools can use that symbol in Quick Plots instead of the default thumbnail-style artwork.
4.10Create a Custom Symbol from an Image
Use image import when you already have artwork, a manufacturer icon, a cleaned-up fixture symbol, or a simple graphic you want to reuse.
- Open Quick Plots(
 ).
). - Open any plot.
- Open Symbols.
- Open the Custom section.
- Tap the add/import control.
- Choose the image source.
- Select a PNG, JPG, HEIC, or SVG file.
- Preview the symbol.
- If the artwork has a white background, use the background removal option if it helps.
- Choose the symbol category, such as Lighting, Network, Power, or Other.
- Add a name that will make sense later.
- Save the symbol.
After it is saved, the symbol appears in the Custom section and can be placed like any other plot symbol.
For SVG imports, use the preview modes to check whether the symbol should stay full color or behave like a tintable plot symbol. If the SVG looks wrong, fix the source artwork and import it again instead of fighting a bad file.
4.11Draw a Custom Symbol in StageTools
Use the draw flow when the symbol is simple enough to build directly in the app.
- Open Quick Plots.
- Open any plot.
- Open Symbols.
- Open the Custom section.
- Tap the draw/create control.
- Draw the symbol on the square canvas.
- Use the drawing tools for lines, boxes, circles, text, freehand strokes, or erasing.
- Use undo/redo while building the symbol.
- Name the symbol.
- Choose the symbol category.
- Save it.
Keep drawn symbols simple. A clean outline reads better on a plot than a detailed illustration, especially once it is scaled down.(![]() )(
)(![]() )(
)(![]() )(
)(![]() )
)
4.12Manage Custom Symbols
Custom symbols are reusable across Quick Plots. You can edit a symbol if the name, category, or artwork needs cleanup. You can delete custom symbols you no longer need.
Do not delete a custom symbol unless you are done using it. If a symbol is still useful but belongs in a different group, edit its category instead.
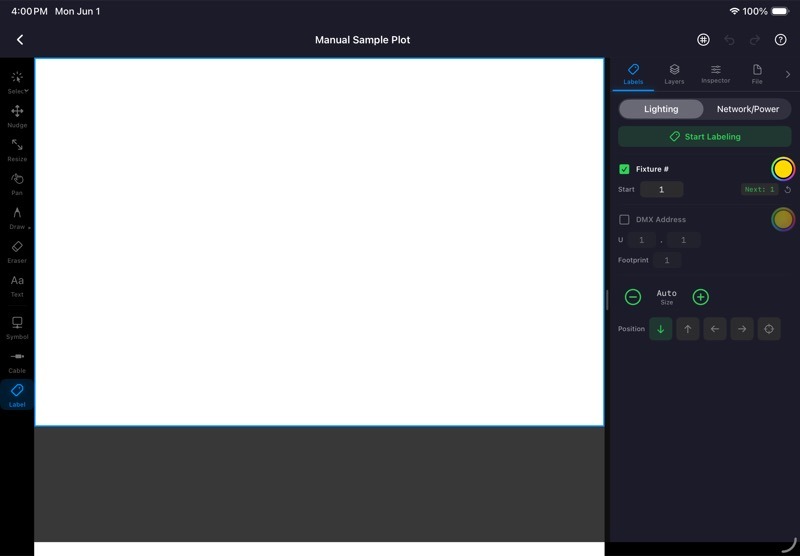
4.13Label Lighting Fixtures
Lighting labels are for fixture numbers, DMX addresses, and other plot-readable identifiers.
Typical workflow:
- Open Labels.
- Choose the Lighting type.
- Set what you want to show: fixture number, address, or both.
- Set the starting number/address and footprint.
- Tap Start Labeling.
- Tap fixtures in order.
StageTools increments labels as you tap. This is meant for quick numbering passes, not a spreadsheet replacement.

4.14Adjust Label Position and Style
Labels are not locked to one spot. After labels are visible, use the label controls to make them readable for the plot you are building.
Common label adjustments:
- Turn fixture number labels on or off.
- Turn DMX/address labels on or off.
- Change label color.
- Change label size.
- Move labels to a different position around the symbol.
- Use separate positions for different label types when the drawing needs more room.
Label position matters on dense plots. Move labels away from cable runs, fixture clusters, and background text so the exported PDF or PNG stays readable.
For Network/Power labels, the same idea applies: keep IP addresses, device names, and notes close enough to the symbol to read, but not directly on top of the cable path.
4.15Use Free-Move Label Position
Use Free label position when the preset Above, Below, Left, and Right positions do not give the label enough room.
Free labels are useful when:
- A fixture is tight against another symbol.
- A cable run crosses the normal label area.
- A background drawing already has text in that spot.
- A Network/Power label needs to sit away from a cable path.
- You want several labels lined up cleanly by hand.
To free-move a label:
- Select the symbol.
- Open Labels or the label controls in the inspector.
- Set Position to Free.
- Turn Connector on if you want a dashed leader line from the symbol to the label.
- Tap the symbol once if it is not already selected.
- Tap the selected symbol again to engage the free label.
- Drag the label badge to the position you want.
- Release to save the position.
- Drag it again if it needs another small adjustment.
The free position is stored with that symbol. You can switch back to Above, Below, Left, or Right later. StageTools remembers the free position, so if you return to Free, the label goes back to the last free-move spot.
Use the Connector option when the label has been moved far enough away that the relationship is not obvious. Leave it off when the label still reads clearly without a leader line.
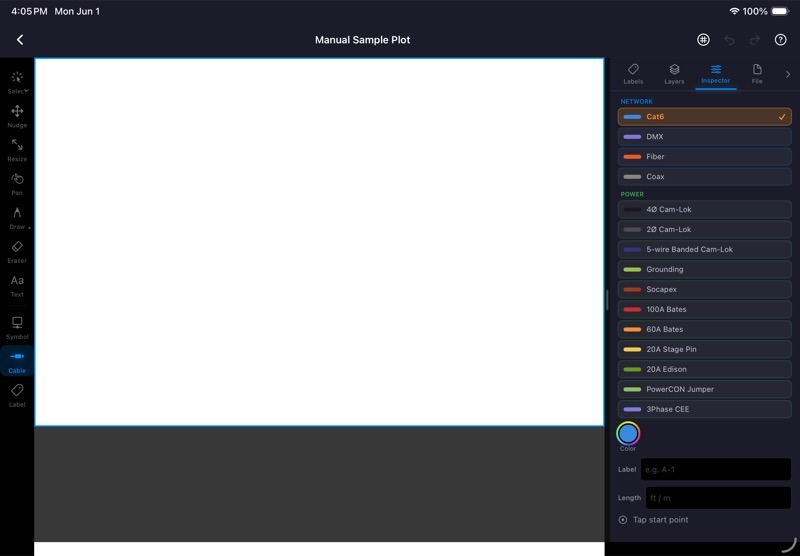
4.16Draw Cables
Use the Cable tool when a run matters enough to show on the plot.
- Open the Cable tool.
- Pick the cable type.
- Tap or drag between points/symbols.
- Add waypoints where the run bends.
- Finish the cable.
- Edit labels, color, or routing if needed.
Keep cable drawings readable. A simple path that shows start, finish, and direction usually beats a perfect trace through every corner of the room.
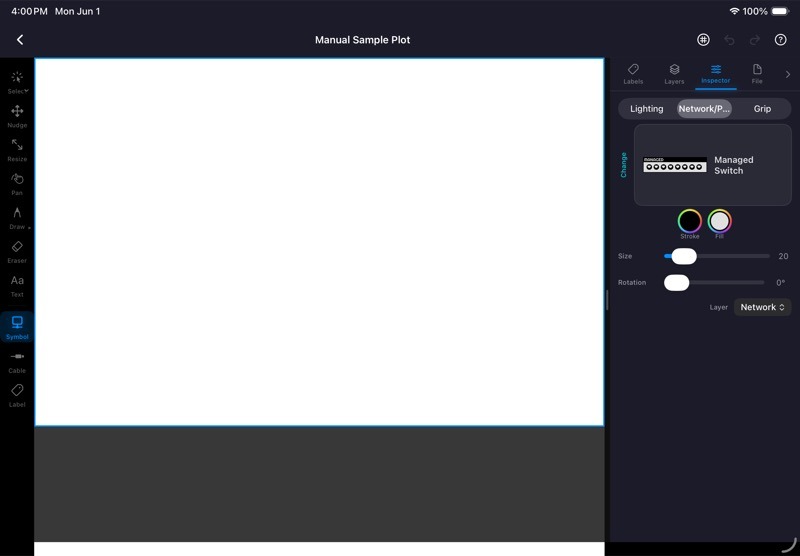
4.17Build Network and Power Layouts
Choose Network/Power in the Symbols panel when you need to map switches, nodes, APs, distros, generators, or power/network paths.
- Open Symbols.
- Choose Network/Power.
- Place the relevant gear.
- Use Cable to connect items.
- Add labels or link saved scan devices.
This is useful for planned topology, live troubleshooting notes, or a quick map of what the rack actually looks like after the third change of the morning.
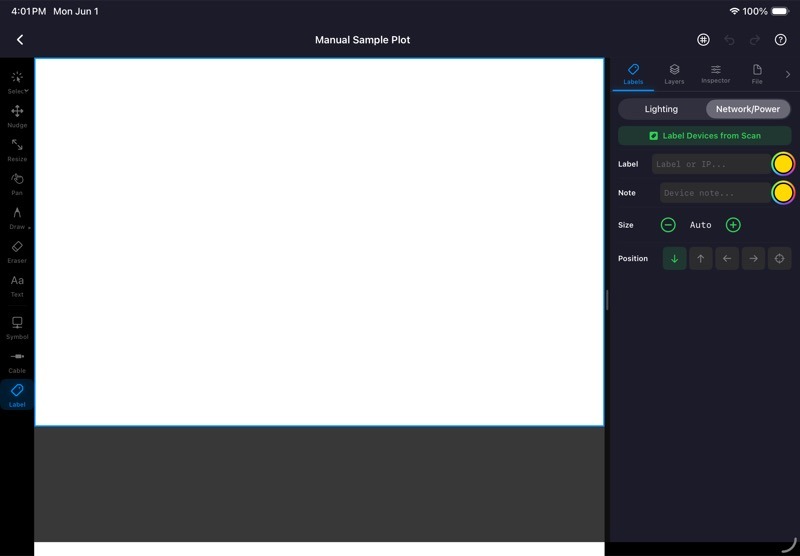
4.18Label Devices from Scan
If you have a saved Network Devices scan, Quick Plots can label topology symbols from that scan.
- Open Labels(
 ).
). - Choose Network/Power.
- Tap Label Devices from Scan.
- Choose the saved scan if prompted.
- Pick the device/IP.
- Tap the topology symbol to label or bind it.
Use this when you want the plot to reflect real devices instead of manually typed labels.
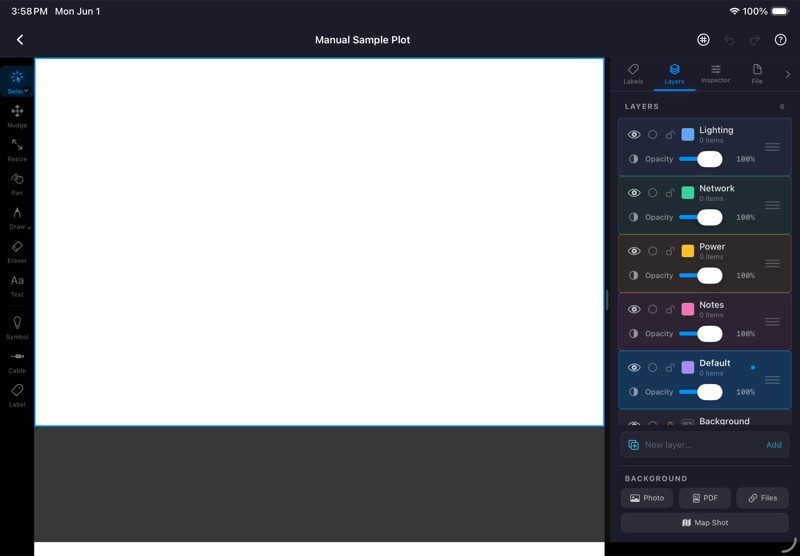
4.19Use Layers
Layers keep busy plots editable.
Use layers for:(![]() )(
)(![]() )(
)(![]() )(
)(![]() )(
)(![]() )
)
- Background.
- Truss or rigging reference.
- Lighting.
- Network.
- Power.
- Notes.
Layer controls can show, hide, grey, lock, reorder, and adjust opacity. Lock a layer when it should stay visible but should not move. Grey a layer when it is reference only.
The active layer matters. If an object will not select, check that you are on its layer before assuming the tap missed.
4.20Export a Quick Plot
Export when the plot is ready to leave the app.
Common outputs:(![]() )
)
- PDF — best for paperwork, email, and printable references.
- PNG — best for quick text messages or image-based sharing.
- Photos — saves an image to the device photo library.
- Files tab — keeps the exported reference inside StageTools.
PDF branding is controlled in Settings. Use it if you want your name, company, or logo on plot exports.
4.21Quick Plot Workflow Example
Use this flow for a small location setup:
- Create a new Quick Plot named after the location.
- Import the scout photo or floor plan as a background.
- Drop fixture symbols where they actually land.
- Add fixture numbers and DMX addresses.
- Draw only the cable runs that someone needs to understand.
- Add Network/Power symbols if nodes, switches, or distros matter.
- Add labels from a saved scan if the network has already been scanned.
- Lock or grey the background layer.
- Export a PDF for paperwork.
- Export a PNG if you need to text it.
This keeps the plot useful without turning a field note into a drafting project.
Chapter 5Scout Notes
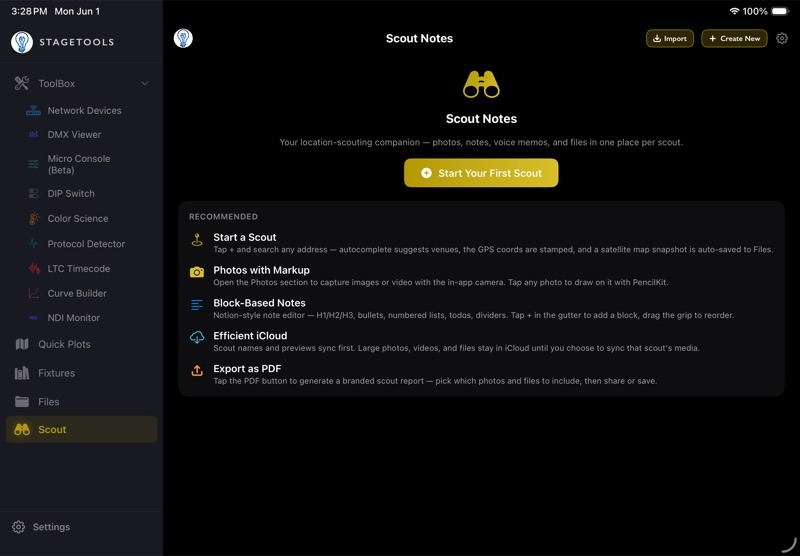
5.1What Scout Notes Is For
Scout Notes is for collecting location information before the job turns into scattered photos, texts, voice memos, and half-remembered measurements.(![]() )
)
A Scout can hold:
- Location name, address, date, and notes.
- Photos and marked-up photos.
- Videos.
- Block-based note tabs.
- Voice memos and transcripts.
- Attached files.
- Map/location references.
- PDF exports.
- Full
.stscoutpackages for backup or handoff.
Use Scout Notes when you want the location record, reference media, and paperwork in one place instead of split across Photos, Notes, Files, and text threads.
5.2Open Scout Notes
Open the Scout tab.
The Scout list shows saved Scouts. Each card represents one location or scout folder. Archived or deleted Scouts stay out of the active list.
From the Scout list you can:
- Start a new Scout.
- Open an existing Scout.
- Search saved Scouts.
- Open recent or favorite Scouts.
- Export or share Scouts when needed.
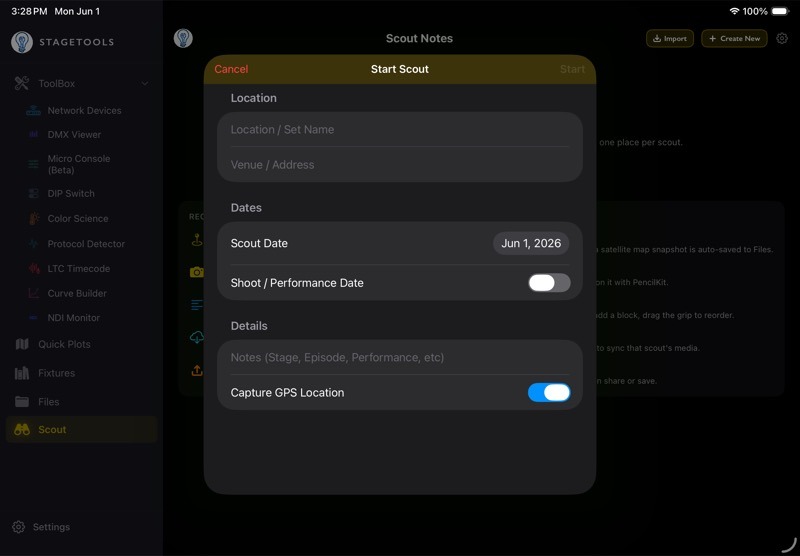
5.3Create a New Scout
- Open Scout.
- Tap Start Scout.
- Enter the location or venue name.
- Add the address if you have it.
- Set the scout date.
- Add any first notes you already know.
- Save the Scout.
Use a location name that will still make sense later. If a production has several spaces in the same venue, include the room, stage, or area in the Scout name.
5.4Scout Detail Sections
Each Scout has four main sections:
| Section | Use It For |
|---|---|
| Photos | Location photos, markup, visual references, and photo captions. |
| Notes | Multi-tab block notes, templates, lists, gear rows, and inline media references. |
| Voice | Voice memos, playback, rename, transcription, transcript search, and Make Scout Notes. |
| Files | PDFs, documents, map images, manuals, links, and other attached reference files. |
(![]() )(
)(![]() )(
)(![]() )(
)(![]() )
)
On iPad, the section bar stays at the bottom so the Notes editor gets the full width. On iPhone, the same sections are arranged for the smaller screen.
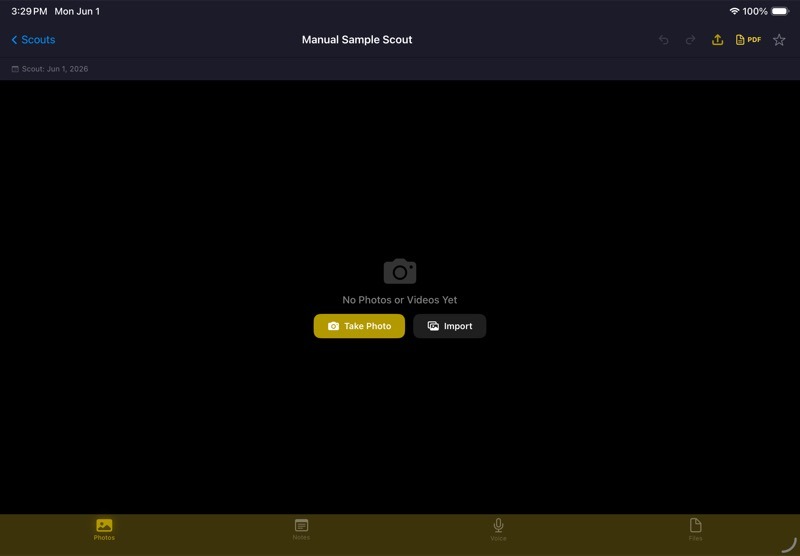
5.5Photos
Use Photos for the visual record of the location.
Typical photo workflow:
- Open a Scout.
- Open Photos.
- Take a new photo or import an existing one.
- Add markup if the photo needs notes, arrows, circles, or measurements.
- Add a caption if the photo needs context.
- Keep only the useful photos selected for PDF export later.
Marked-up photos are useful for entrances, rigging points, cable paths, dimmer rooms, network racks, ceiling conditions, power locations, and anything that will save a phone call later.
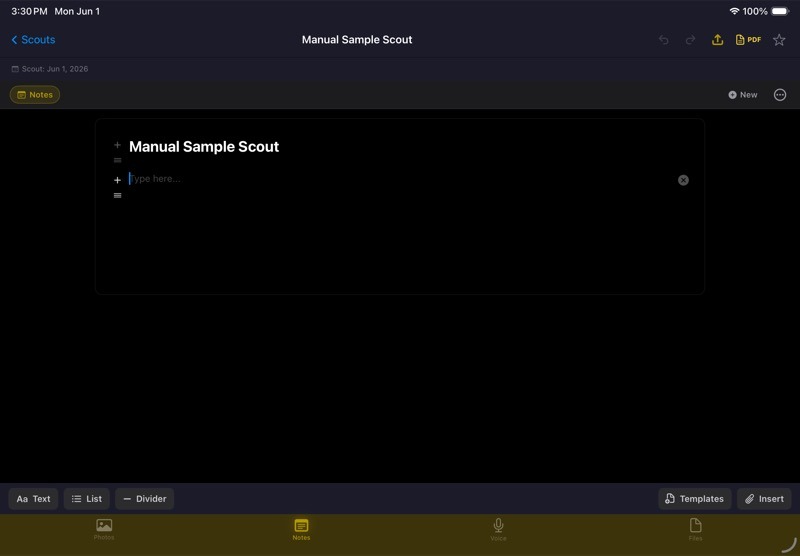
5.6Notes
Scout Notes uses a block editor. A Scout can have multiple note tabs, so you can split one location into useful pages instead of keeping one long note.
Use note tabs for:
- General notes.
- Gear list.
- Power.
- Network.
- Rigging.
- Parking/load-in.
- Questions for production.
Common note actions:
- Create a new note tab.
- Rename a note tab.
- Reorder note tabs.
- Add text blocks.
- Add list blocks.
- Use templates.
- Insert photos, files, videos, or voice memos from the Scout.
- Multi-select note lines and delete them together.
Templates are editable. Use defaults when they fit, duplicate a template when you want a variation, or create a custom template for the way you scout.
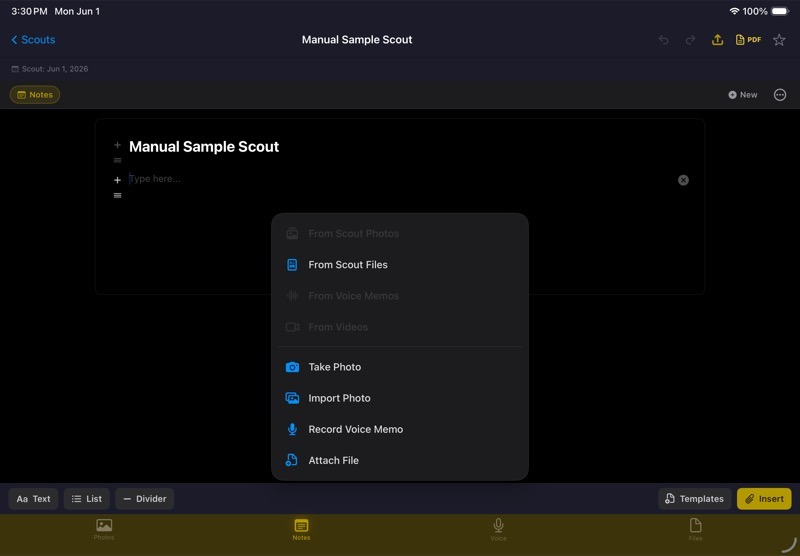
5.7Insert Scout Media into Notes
Notes can reference media already attached to the Scout. This keeps the write-up readable without making the user hunt through every section.
To insert media into a note:
- Open the Scout.
- Open Notes.
- Open the note tab you want.
- Tap Insert.
- Choose the media type.
- Pick an existing photo, file, video, or voice memo.
- Insert it into the note.
If you capture or import new media while working in Notes, StageTools can add it to the Scout and place it into the current note.
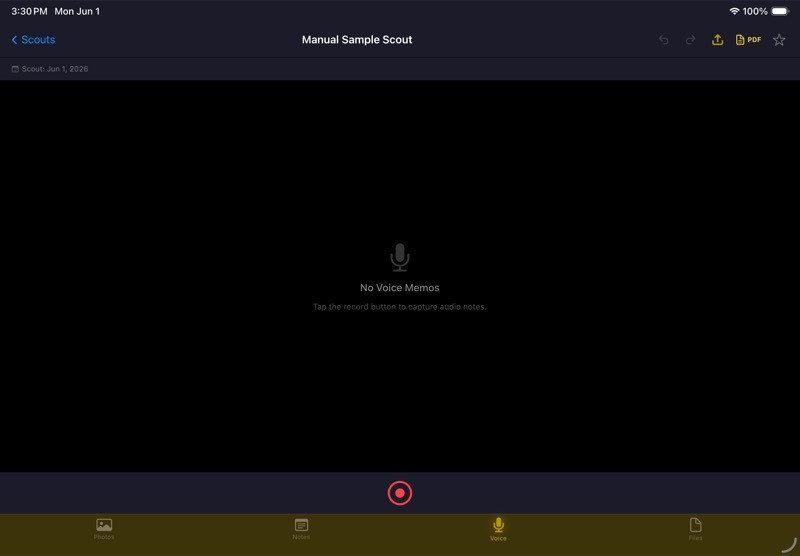
5.8Voice Memos
Use Voice when talking is faster than typing.
Typical voice workflow:
- Open a Scout.
- Open Voice.
- Record the memo.
- Stop recording.
- Rename the memo so it is useful later.
- Play it back or scrub through it when needed.
- Transcribe it if the spoken notes should be searchable or included in the write-up.
Voice memos can be searched after transcription. Search results can open the matching memo and jump to the relevant transcript area.
5.9Transcribe a Voice Memo
Transcription turns a voice memo into searchable text. Use it when the spoken notes need to become part of the Scout record instead of staying buried in audio.
- Open the Scout.
- Open Voice.
- Find the memo.
- Tap Transcribe.
- Leave the Scout open or keep working; StageTools shows transcription progress while it runs.
- Open the transcript when it is done.
If the memo already has a transcript, the Voice row shows transcript controls instead of the Transcribe button.
5.10Work with a Transcript
After a memo has a transcript, you can:
- Open the transcript.
- Copy the full transcript.
- Edit the transcript.
- Delete the saved transcript without deleting the audio.
- Search transcript text from the Scout list or Voice search.
- Use timestamped lines to jump back into the audio when timing is available.
Editing a transcript clears the Apple-generated timing for that edited text. The transcript stays searchable, but timestamped playback only applies to timed transcript lines.
StageTools learns from transcript edits and corrected key moments. If the app hears a lighting term wrong and you fix it, future transcript cleanup can use that correction.
5.11Send Transcript Content to Notes
Inside the transcript view, Send to Notes gives you several ways to turn the transcript into note blocks.
| Option | What It Sends |
|---|---|
| Make Scout Notes | StageTools AI cleanup with summary, gear, locations, tasks, follow-up questions, uncertain items, and cleaned transcript text. |
| Full Transcript | The entire transcript, a memo reference, and metadata. |
| Key Moments | Detected gear, cable, power, rigging, task, and location lines. |
| Selected Key Moments | Only the key moments you selected before sending. |
| Clean Summary | A normalized review list grouped into gear, cable, power, rigging, tasks, and locations. |
Before inserting, StageTools opens a preview. Pick the destination note tab, remove anything you do not want, edit rows if needed, then insert.
5.12Use Make Scout Notes
Make Scout Notes uses StageTools AI to turn a transcript into structured Scout note blocks.
Use it first when you have a longer memo and want the app to draft a cleaner set of notes from it.(![]() )
)
Make Scout Notes can return:
- A short summary.
- Gear items with quantities when available.
- Location notes.
- Tasks.
- Follow-up questions.
- Items that need review.
- A cleaned transcript.
Typical workflow:
- Open the transcript.
- Tap Make Scout Notes.
- Let StageTools process the transcript. You can leave the screen while it works.
- When it finishes, review the generated notes.
- Choose the destination note tab.
- Remove anything that is not useful.
- Edit the remaining blocks if needed.
- Insert the notes.
If Make Scout Notes has already run for that memo, the button changes to Review Scout Notes so you can open the latest result again.
Make Scout Notes sends transcript text to the StageTools backend for cleanup. The iOS app does not store the OpenAI API key. Review AI-generated notes before using them in a report or sending them to production.
StageTools shows the remaining Scout AI assists for the current month in the Make Scout Notes card.
5.13Use Key Moments
Key Moments are detected from the transcript and grouped by the kind of information they look like.
StageTools looks for:(![]() )(
)(![]() )(
)(![]() )(
)(![]() )(
)(![]() )(
)(![]() )
)
- Gear.
- Cable.
- Power.
- Rigging.
- Tasks.
- Locations.
Use Key Moments when you want a quick pass over the transcript without sending the whole thing to Notes.
Typical workflow:
- Open the transcript.
- Review the Key Moments section.
- Delete any bad moment.
- Edit a moment if the text or category is wrong.
- Select only the moments you want, or leave none selected to use all detected moments.
- Tap Key Moments or Selected Key Moments under Send to Notes.
- Review the note preview.
- Insert into the destination note tab.
5.14Use Clean Summary
Clean Summary turns the transcript's useful moments into a tighter, more note-ready list.
It is useful for messy walk-and-talk notes where the same idea may be said several times.
Clean Summary can produce grouped sections for:
- Gear.
- Cable.
- Power.
- Rigging.
- Tasks.
- Locations.
When you open Clean Summary Review, you can:
- Choose the destination note tab.
- Edit item names.
- Edit quantities.
- Change categories.
- Remove items.
- Resolve duplicate gear mentions.
- Merge quantities or use the latest quantity when the same gear shows up more than once.
- Insert the reviewed summary into Notes.
Your edits help StageTools learn better cleanup for future transcripts.
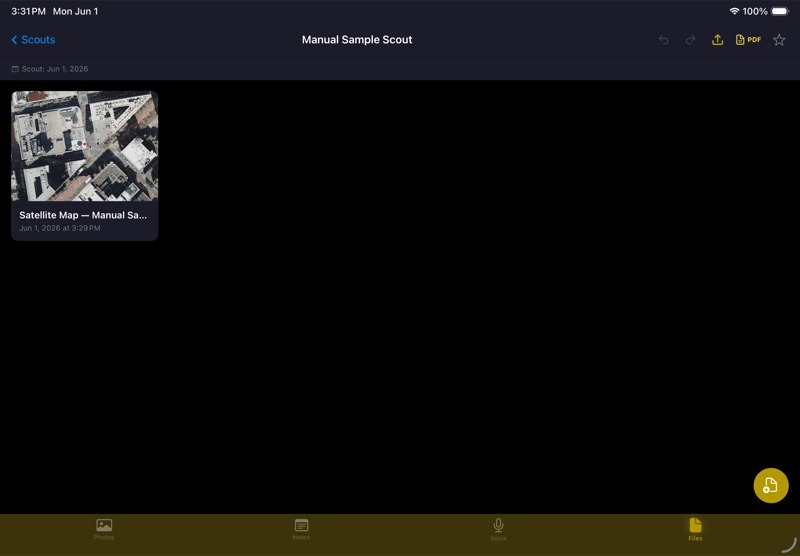
5.15Files
Use Files inside a Scout for reference material tied to that location.
Scout files can include:
- PDFs.
- Images.
- Manuals.
- Plots.
- Riders.
- Links or saved references.
- Map/satellite images.
Use this section for anything that belongs with the Scout but is not a note, photo, video, or voice memo.
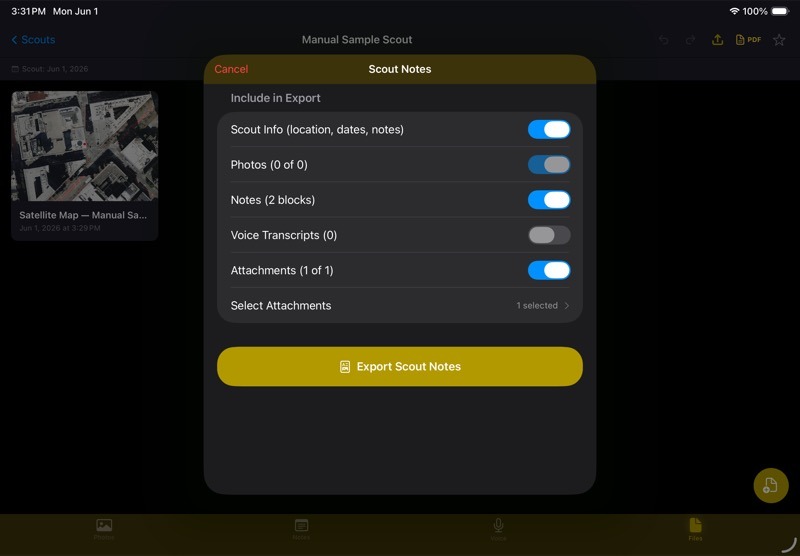
5.16Export a Scout PDF
Use PDF export when you need a readable scout report.
- Open the Scout.(
 )
) - Open the export action.
- Choose what to include: scout info, photos, notes, files, and voice transcripts.
- Choose specific photos or files if you do not want everything included.
- Export the PDF.
- Share, save, or send the PDF.
Scout PDF branding is controlled in Settings under PDF Branding. If branding is enabled for Scouts, the export can include your name, company, logo, and accent color.
Keep the export tight. A report with the right 12 photos is usually better than every photo you took.
5.17Share or Back Up a Scout with .stscout
Use .stscout export/import when you need to move the whole Scout, not just a report.
A .stscout package can include the Scout data and referenced media. Use it for:
- Backing up an important Scout outside iCloud.
- Sending a Scout to another StageTools user.
- Moving a Scout when iCloud is slow.
- Keeping a job archive with the media included.
PDF export is for reading. .stscout export is for transfer and backup.
5.18Create a Quick Plot from a Scout
Use this when a location scout turns into a plot.
- Open the Scout.
- Choose the create/open Quick Plot action.
- Pick the Scout reference you want to use, such as a location image or map shot if available.
- Create the Quick Plot.
- Add symbols, labels, cables, and notes in Quick Plots.
This keeps the scout record and the plot connected in the way you actually work: first the location, then the plan.
5.19Scout Workflow Example
Use this flow for a location walk-through:
- Create a new Scout with the venue name, address, and date.
- Take wide photos first: exterior, load-in, main room, power, ceiling, control area.
- Mark up the photos that need explanation.
- Record a voice memo while walking the space.
- Transcribe the memo when the walk is done.
- Use Notes to turn the useful details into sections.
- Attach any PDFs, plots, or venue paperwork.
- Create a Quick Plot if the location needs a visual layout.
- Export a PDF report for production or the crew.
- Export
.stscoutif another StageTools user needs the full Scout.
The goal is not to document everything. The goal is to capture the things you will wish you had later.
Chapter 6Files
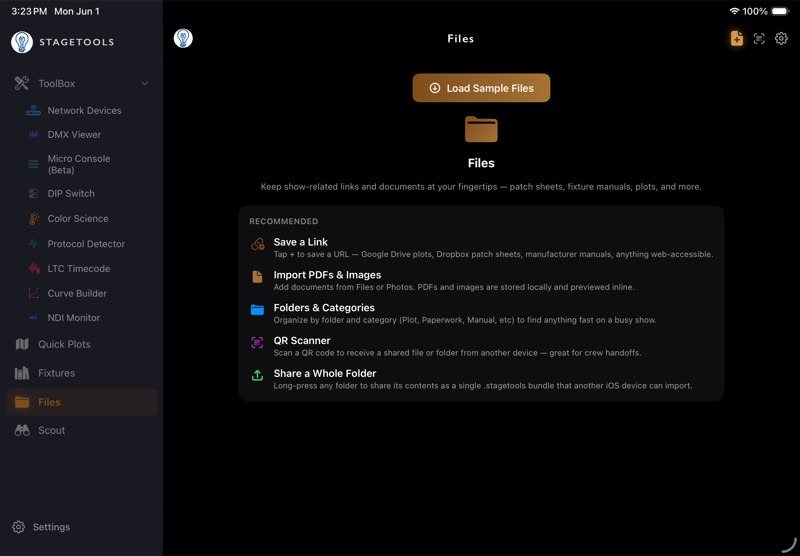
6.1What Files Is For
Files is the reference drawer inside StageTools. Use it for documents and links you need on a job: plots, patch sheets, manuals, network diagrams, riders, call sheets, venue docs, and saved web references.(![]() )
)
Files can store two kinds of items:
- Links — web pages, cloud documents, manuals, fixture pages, shared drives, or other URLs.
- Local files — imported PDFs, images, documents, and files from the iOS Files app.
Files can also organize items with folders, categories, favorites, search, previews, QR scanning, and folder sharing.
6.2Open Files
Open the Files tab.
The Files list shows saved items. Use search, folders, categories, and favorites to narrow the list when it gets busy.
Each file row can show:
- File name.
- Category.
- Notes.
- Folder.
- Favorite state.
- Whether the item is a local file or a link.
6.3File Categories
Files uses a short category list so references stay scannable.
| Category | Use It For |
|---|---|
| Lighting Plot( | Plots, rig sketches, exported Quick Plots, room layouts. |
| Patch Sheet( | Patch, address, universe, channel, or paperwork references. |
| User Manuals( | Fixture manuals, console manuals, node manuals, hardware docs. |
| Network Diagram( | Topology maps, rack diagrams, IP plans, switch layouts. |
| Other( | Anything useful that does not fit the other categories. |
Categories are separate from folders. Use categories for what the file is. Use folders for where it belongs.

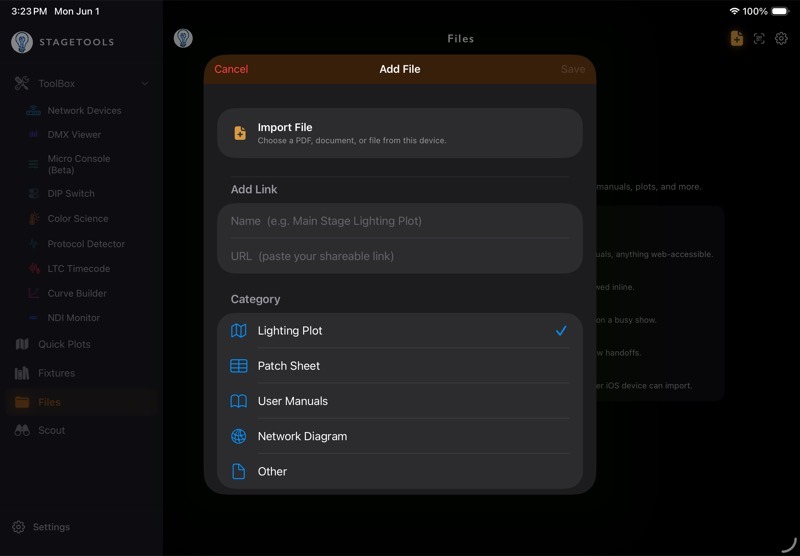
6.4Save a Link
Use saved links for cloud docs, web manuals, fixture pages, venue pages, or shared references.
- Open Files(
 ).
). - Tap the add button.
- Enter the name.
- Paste the URL.
- Choose a category.
- Add notes if needed.
- Choose a folder or create a new one.
- Save.
If the link points to a Google Drive file or another shared cloud document, make sure the sharing permissions are set correctly outside StageTools. StageTools can save the link, but it cannot fix a private link that the other person cannot open.

6.5Import a Local File
Use import when you want the file saved inside StageTools instead of just linking to it.
- Open Files(
 ).
). - Tap the add button.
- Choose Import File.
- Pick a file from the iOS Files app.
- Confirm the name.
- Choose a category.
- Choose a folder if needed.
- Save.
Imported files are stored locally in StageTools. Use this for PDFs or references you need even when the internet is bad.
6.6Organize with Folders
Folders group files by show, venue, day, department, or whatever structure makes sense for the job.
Common folder uses:
- One folder per show.
- One folder per venue.
- One folder per scout.
- One folder for manuals.
- One folder for current paperwork.
To create a folder:
- Open Files.
- Use the folder row or folder picker.
- Choose New Folder.
- Name the folder.
- Save or move files into it.
Deleting a folder does not delete the files inside it. The files stay in the library and lose the folder tag.
6.7Move Existing Files into a Folder
Use this when you already have saved files and want to clean up the library.
- Open Files.
- Select the target folder.
- Open the folder actions.
- Choose the move/add existing files option.
- Select the files you want in that folder.
- Save.
Files can be moved between folders later by editing the file.
6.8Use Favorites
Favorites are for references you open constantly.
- Swipe left on a file row.
- Tap Favorite.
- Use the favorites filter when you want to see only starred items.
Use favorites for the current plot, current patch, console manual, venue packet, or any document you know you will open more than once.
6.9Preview Files
Tap a file row to open it.
StageTools opens links in an in-app browser. Local files use the system preview controller when possible.
Common preview types:
- PDFs.
- Images.
- Documents supported by iOS preview.
- Web links.
If a local file does not preview cleanly, open it through the iOS share sheet in another app that supports that file type.
6.10Edit or Delete a File
Swipe left on a file row to manage it.
Available row actions:
- Favorite or unfavorite.
- Edit.
- Delete.
Use Edit to change the name, URL, category, notes, or folder. Use Delete when the item should be removed from the Files library.
Deleting a local imported file removes the saved file record and the local imported copy from StageTools.
6.11Scan a QR Code
Use QR scanning when another device or crew member is sharing a reference by QR code.
- Open Files.
- Tap the QR scanner.
- Point the camera at the QR code.
- Confirm the link or imported reference.
- Save it to Files.
This is useful for fast handoffs when typing a URL is the slowest possible way to do the job.
6.12Share a Folder
Use folder sharing when you want to hand off a group of saved Files items together.
- Open Files().
- Select the folder.
- Open the folder actions.
- Choose Share Folder.
- StageTools creates a
.stagetoolsbundle for that folder. - Share it through the iOS share sheet.
Another StageTools user can import that folder bundle into their Files tab.
Use folder sharing for a venue packet, a show folder, a collection of manuals, or a group of references that belong together.
6.13Files in Other StageTools Workflows
Files connects to other parts of StageTools.
Use Files with Quick Plots when:
- You want to import a saved Files item as a plot background.
- You exported a Quick Plot and want to save it back into Files.
Use Files with Scout Notes when:
- A Scout needs a PDF, image, map, or venue document attached.
- A note needs an inline reference to a file.
- A Scout PDF export should include attached files.
Files is not just storage. It is the place StageTools can pull from when another workflow needs a document.
6.14Files Workflow Example
Use this flow for a venue packet:
- Create a folder named for the venue or show.
- Import the current plot PDF.
- Save links to the venue page and shared production drive.
- Import fixture manuals or node manuals you expect to need offline.
- Set categories for each item.
- Favorite the current plot and patch sheet.
- Share the folder if another StageTools user needs the same packet.
Keep Files boring and organized. That is the whole point.
Chapter 7Fixtures
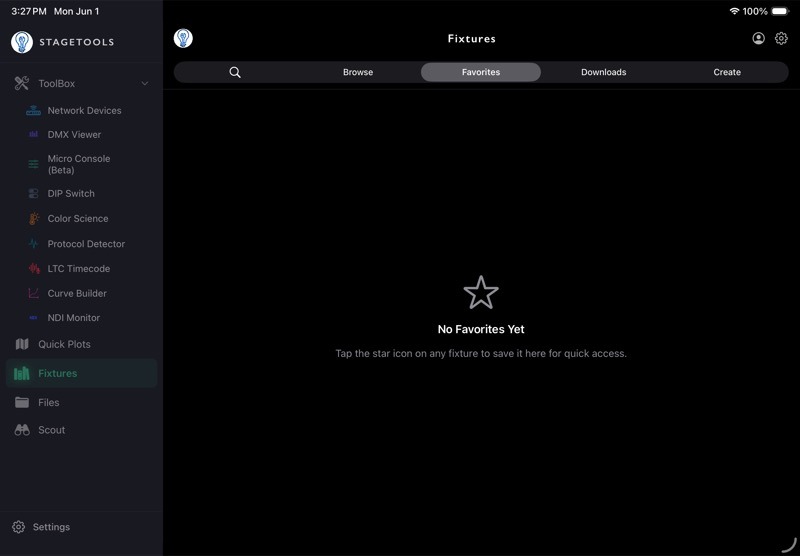
Fixtures is the GDTF reference and download area in StageTools. Use it to search the GDTF Share Library, browse by manufacturer, favorite fixtures you use often, download .gdtf files for offline reference, and place fixture profiles into Quick Plots.(![]() )
)
Fixtures is not a replacement for checking the actual unit, show paperwork, or console patch. Treat it as the fixture reference library inside StageTools.
7.1Open Fixtures
- Open StageTools.
- Tap Fixtures.
- Choose the section you need: Search, Browse, Favorites, or Downloads.
Use Search when you know the fixture name. Use Browse when you know the manufacturer. Use Favorites for common fixtures. Use Downloads for files already saved on the device.
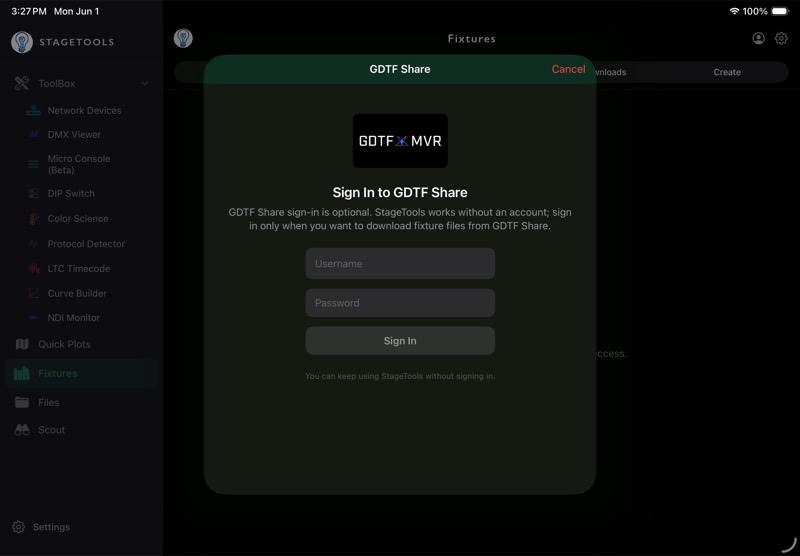
7.2Sign In to GDTF Share
StageTools uses the GDTF Share Library for fixture data. A free GDTF Share account is used for downloading fixtures and viewing the latest online fixture details.
To sign in:(![]() )(
)(![]() )
)
- Open Fixtures.
- Tap the sign-in control in the header or open the GDTF Share sign-in prompt.
- Enter your GDTF Share username and password.
- Sign in.
You can create a free account at gdtf-share.com.
Search may still show cached or bundled index results without signing in, depending on what is stored on the device. Downloading current .gdtf files and loading full revision details requires an internet connection and a valid GDTF Share sign-in.
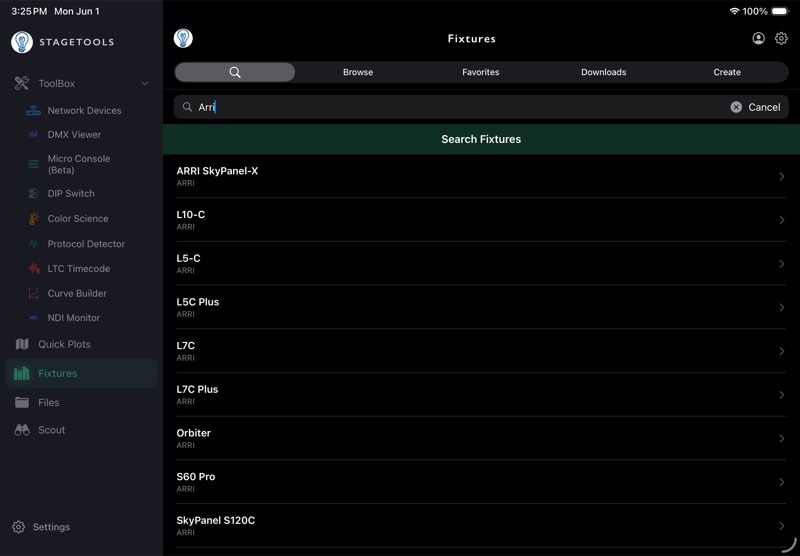
7.3Search Fixtures
Use Search when you know the fixture name, model family, or manufacturer.
- Open Fixtures(
 ).
). - Choose Search.
- Type part of the fixture or manufacturer name.
- Review the results.
- Tap a fixture to open its available revisions.
If the search returns too many results, add more of the model name or manufacturer name. StageTools limits very broad result sets so the list stays usable.
If the fixture index is not available yet, sign in and refresh or build the local fixture index when StageTools offers that option.
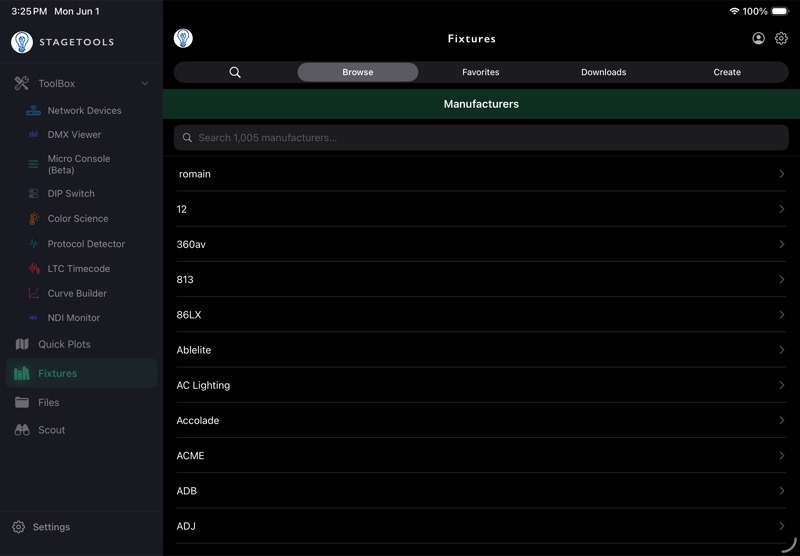
7.4Browse by Manufacturer
Use Browse when you know the brand but do not know the exact fixture name.
- Open Fixtures.
- Choose Browse.
- Select a manufacturer.
- Select a fixture from that manufacturer.
- Open the fixture revisions or detail page.
Browsing is useful when fixture names are listed differently than expected, or when a manufacturer has several related versions of the same unit.
7.5Fixture Revisions
A fixture can have more than one GDTF revision. Revisions may differ by author, date, fixture mode coverage, or corrected metadata.
Use the revisions list to:
- Confirm the fixture manufacturer and model.
- Check available revisions.
- Favorite the fixture with the star control.(
 )
) - Open a revision detail.(
 )
) - Download the
.gdtffile.
When in doubt, choose the newest useful revision and confirm the DMX modes against the production paperwork or fixture manual.
7.6Fixture Detail
The fixture detail page shows the information StageTools can read from the selected GDTF file.
Depending on the file, you may see:
- Fixture thumbnail.
- Manufacturer and fixture name.
- Fixture type or short name.
- DMX mode count.
- Maximum channel count.
- Weight or power data.
- Revision date and creator.
- DMX modes and their channel counts.
GDTF files are created and maintained by their authors. Some files include complete thumbnails and physical data. Others may only include the information needed for console/profile use.
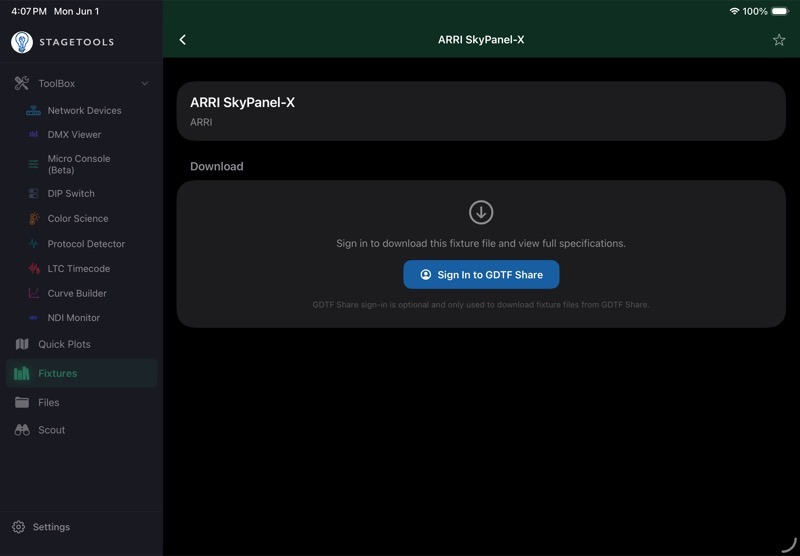
7.7Download a Fixture
Download fixtures you expect to reference again or use when you may not have internet on-site.
- Open the fixture detail page.
- Tap Download .gdtf.
- Wait for StageTools to finish saving the file.
- Open Downloads to confirm it is saved.
Downloaded fixtures stay on the device and can be opened later from the Downloads section.
7.8Use Favorites
Favorites keep common fixtures close without downloading every file immediately.
- Open a fixture or revision list.
- Tap the star control.
- Open Favorites to see starred fixtures.
Use Favorites for fixtures you see often, house inventory, rental packages, or units you want to place into a Quick Plot quickly.
To remove a favorite, delete it from Favorites or unstar it from the fixture page.
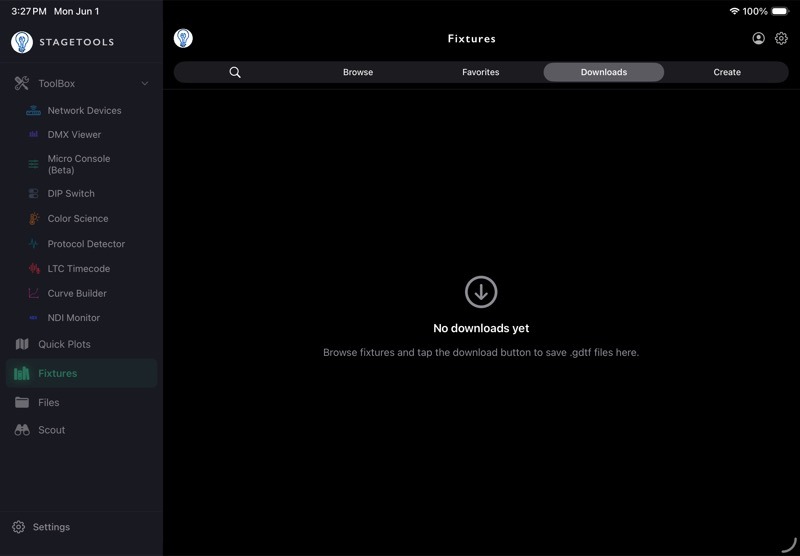
7.9Use Downloads Offline
Fixtures can browse and search online data only when the device has a network connection. Downloaded fixtures are different: they are saved locally and remain available offline.
When you are offline:(![]() )(
)(![]() )
)
- Open Fixtures.
- Go to Downloads.
- Open a saved fixture.
- Review the local fixture detail.
- Share the downloaded
.gdtffile if needed.
Use Downloads before a stage, location, or truck day where internet may be unreliable.
7.10Share a Downloaded GDTF File
Use sharing when another device, console workflow, or crew member needs the downloaded .gdtf file.
- Open Fixtures().
- Choose Downloads.
- Find the downloaded fixture.
- Tap the share control.
- Send the
.gdtffile through the iOS share sheet.
Sharing sends the downloaded fixture file. It does not share your GDTF Share sign-in.
7.11Place a Fixture on a Quick Plot
Fixtures can send a fixture profile into Quick Plots.
- Open a fixture detail page or use a fixture from Favorites.(
 )
) - Choose Place on Lighting Plot.
- Select the target Quick Plot.
- If StageTools has a usable GDTF thumbnail, it uses that thumbnail as the fixture symbol.
- If no usable thumbnail is available, choose the closest matching symbol.
- Place and label the fixture in Quick Plots.
After the fixture is on the plot, use the normal Quick Plots tools to move it, label it, place cables, set layers, or change the symbol later.
7.12Fixture Troubleshooting
If search does not find the fixture:
- Search with fewer words.
- Search by manufacturer.
- Check spelling and model punctuation.
- Refresh or build the local index when StageTools offers it.
- Sign in to GDTF Share and try again.
If a download fails:
- Confirm the device is online.
- Confirm you are signed in to GDTF Share.
- Try the download again.
- Check Downloads before retrying repeatedly; the file may already be saved.
If a thumbnail is missing or does not look useful:
- Open the fixture detail and confirm the rest of the data.
- Place the fixture with a generic symbol.
- Use Quick Plots custom symbols if you need a more accurate plot symbol.
If fixture data looks wrong:
- Check the revision date and creator.
- Compare the DMX modes against the fixture manual or show paperwork.
- Try another available revision if one exists.
7.13Fixture Workflow Example
Use this flow before a prep:
- Search or browse for the fixtures in the package.
- Favorite the fixtures you expect to use repeatedly.
- Open each fixture detail and check the available DMX modes.
- Download the
.gdtffiles you may need offline. - Place key fixtures into the Quick Plot.
- Label the fixtures in Quick Plots with unit number, address, purpose, or notes.
- Keep Downloads available for reference on stage.
Chapter 8Network Devices
Network Devices scans the current show network, lists discovered devices, lets you tag and label them, saves scan profiles, builds topology maps, and monitors devices with live ping status.(![]() )
)
Use it before troubleshooting DMX, ArtNet, sACN, media servers, nodes, consoles, wireless bridges, or any other device on the lighting network.
8.1Open Network Devices
- Open ToolBox.
- Tap Network Devices.
- Confirm the device is connected to the correct Wi-Fi or USB-C Ethernet network.
- Choose Quick or Deep.
- Tap Scan.
StageTools prefers USB-C Ethernet when it is available. Ethernet is usually the better choice on lighting networks.(![]() )(
)(![]() )
)
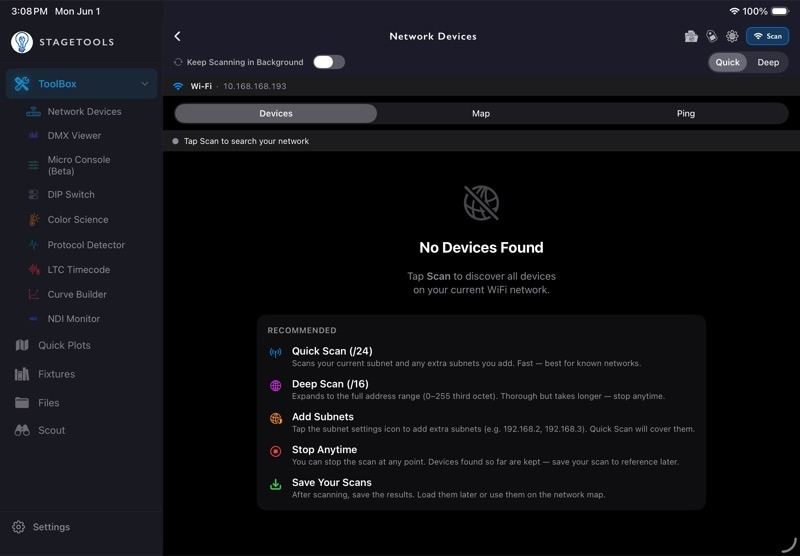
8.2Choose Quick or Deep Scan
Use Quick for normal work. Quick Scan checks the configured /24 subnet for the selected interface and any extra subnets you added.
Use Deep when the network may be spread across a wider /16 range or when the expected devices do not appear in a normal scan.
Quick Scan is the right first move for most jobs:
- It is faster.
- It covers the current interface subnet.
- It includes extra subnets you manually added.
- It is easier to interpret when you know the network plan.
Deep Scan is useful when:
- The subnet plan is unclear or the network is organized across different subnets.
- Devices are on nearby ranges.
- A saved network packet or old paperwork may not match the live rig.
- You need a broader search and can wait longer.
You can stop a scan after the devices you need have appeared. Devices found so far stay in the list.

8.3Keep Scanning in Background
The Keep Scanning in Background toggle lets StageTools keep the scan running when you leave Network Devices.
Use it when:
- You are waiting for devices to boot.
- You are moving around a venue and want the scan to keep collecting.
- You are checking whether devices appear after a switch, node, or console is powered up.
Turn it off when you want Network Devices to stop scanning as soon as you leave the page.
8.4Network Settings
Open Network Settings from the Network Devices header when you need to control what StageTools scans.
Network Settings includes:
- Network Interface(
 ) — Auto prefers USB-C Ethernet, otherwise Wi-Fi.
 - Extra Subnets to Scan(
 ) — add additional
 /24ranges such as192.168.2or10.135.1. - Blocked IP Ranges(
 ) — skip IP ranges that should not be probed.
Extra subnets use the first three octets. StageTools accepts values like 192.168.1, 192.168.1.0, or 192.168.1.0/24 and normalizes them to the subnet prefix.
Use blocked ranges for DHCP pools, proxy-responding consumer gear, or IP ranges you do not want StageTools to scan.
8.5Read Scan Results
After a scan, the Devices tab shows discovered devices with IP address, detected name or hostname, device type hints, response time, tags, favorite status, protocol badges, and saved labels when available.
The discovery summary shows how many devices were found and can reveal discovery details by source or subnet. Use the summary menu to export a scan report when you need to send the current network state to someone else.
Device rows can show:
- IP address.
- Hostname or device display name.
- Detected type hint.
- HTTP server banner when available.
- Response time.
- User tag.
- Favorite star.
- Protocol badges detected from the Protocol Detector.
8.6Search, Filter, and Sort
Use the search field to narrow a scan result.(![]() )(
)(![]() )(
)(![]() )(
)(![]() )
)
You can search by:
- Last IP octet.
- Full or partial IP address.
- Hostname.
- Detected device type.
Use filter pills to show:
- All devices.
- Favorites.
- Console.
- Switch.
- Node.
- Wireless.
- Computer/Tablet.
- Media Server.
- Other.
Use the sort menu to sort by IP, Name, or Tag.
8.7Tag, Favorite, and Label Devices
Tags and labels make repeat scans easier to read.
Use tags for broad device type:
- Console.(
 )
) - Switch.(
 )
) - Node.()
- Wireless.()
- Computer/Tablet.(
 )
) - Media Server.(
 )
) - Other.(
 )
)
Use custom labels for names that matter on the job: FOH Console, Dimmer Beach Node 1, Stage Left Switch, or Video Server.
To edit one device:
- Swipe the device row.
- Choose Edit.
- Set the custom label, tag, or favorite status.
- Save.
To edit multiple devices:
- Tap Select.
- Select the devices.
- Use the bottom action bar to tag, favorite, unfavorite, or label them.
- Tap Done.
Deleting a device from the current scan hides it from the current results. It appears again on a later scan if StageTools finds it again.
8.8Use Device Details
Tap a device to open Device Details.
Device Details can show:
- Custom label or detected name.
- Hostname.
- Map icon size.
- IP address with copy button.(
 )
) - Response time.
- Detected type.
- Tag.
- Favorite status.
- Live ping status.
From Device Details you can start or stop ping monitoring for that device, copy the IP address, set the map icon size, or open http://<device IP> in the browser.(![]() )(
)(![]() )(
)(![]() )
)
Use Open in Browser for web-configurable nodes, switches, wireless devices, media servers, or other devices with a web interface.
8.9Save and Share Scan Profiles
Save a scan when you want to revisit a known network later.
- Run a scan.
- Open Scan Profiles.
- Review the current scan summary.
- Tap Save Scan(
 ).
). - Name the scan.()
- Add notes if useful.
- Save.
Saved scan profiles store the device IP list and extra subnet settings. Use them for venues, trucks, stages, recurring shows, or any network you expect to see again.
You can also share a saved scan profile through the iOS share sheet. Another StageTools user can import the shared scan.
8.10Export a Scan Report
Use scan report export when you need a readable network summary for a crew member, vendor, or troubleshooting thread.
- Run a scan.()
- Open the discovery summary menu.
- Choose Export scan report...
- Share the generated report.
The report includes scan configuration, subnet/source summaries, devices found, tags, labels, and useful network notes.
8.11Use the Ping Monitor
The Ping tab monitors selected devices and shows whether they stay online.
To monitor a device:(![]() )
)
- Run a scan.
- Open Ping.
- Tap the plus control next to a device.
- Watch the status, response time, uptime, and ping count.
A monitored device card shows:
- Current status.
- Latest response time.
- Sparkline history.
- Average response time.
- Uptime percentage.
- Total pings.
Use Ping Monitor when a device is dropping offline, a wireless bridge is unstable, a node is rebooting, or a switch path is suspect.
8.12Use the Network Map
The Map tab turns scan results into a visual topology.
Use the map to:(![]() )(
)(![]() )
)
- Add scanned devices to a layout.
- Move devices into a readable topology.
- Change map icon sizes.
- Draw connections between devices.
- Label connection types.
- Save and load map layouts.
- Share a topology map.
The map can also import linked devices and cable connections from a Quick Plot. Use this when your Quick Plot already has Network/Power symbols linked to scanned devices.
8.13Save and Load Network Maps
Save a map when the device layout matters beyond the current scan.
- Open Map.
- Arrange devices and connections.
- Tap Save.
- Name the map.
- Save as a new map or update an existing map.()
Saved maps can include device positions, topology connections, custom node sizes, background image data, and saved device information.(![]() )
)
Use saved maps for permanent venue networks, dimmer beach layouts, stage rack layouts, truck packages, or touring systems.
8.14Import from Quick Plot
If a Quick Plot has linked network devices, Network Devices can import that layout into the Map tab. This is useful when you already built a premade network/power Quick Plot and want it to become the starting point for a live network map.
A Quick Plot is ready to import when it has:
- Network/Power topology symbols.
- Devices linked to those symbols by IP address.
- Cable runs whose endpoints land near the linked symbols.
- A background image or reference plan if you want the map to keep that visual context.
StageTools only imports symbols that have a linked IP. Plain text notes, unlinked symbols, drawings, and lighting-only symbols stay in the Quick Plot. If the same IP is linked to more than one symbol, StageTools uses one symbol for that IP in the Network Map.
- Open Network Devices.
- Open Map.
- Choose the import option.
- Select the Quick Plot.(
 )
) - Check the preview count for linked devices and cables.(
 )
) - Review the listed devices and IP addresses.
- Tap Import.
The import keeps the device positions from the Quick Plot. It also builds map connections from Quick Plot cables when the cable endpoints are close enough to linked symbols. If the Quick Plot has a background image, StageTools uses the cropped plot background so the Network Map lines up with what you saw in Quick Plots.
After importing:
- Move any devices that need a cleaner map layout.
- Open device details to change map icon size if needed.
- Edit imported connections if cable labels or cable types need cleanup.
- Add any scanned devices that were not part of the premade Quick Plot.
- Save the Network Map.
8.15Network Devices Troubleshooting
If no devices appear:
- Confirm the iPhone or iPad is on the correct lighting network.
- Try USB-C Ethernet if available.
- Check Network Settings and confirm the selected interface.
- Add the expected subnet under Extra Subnets.
- Try Deep Scan if the network range is unclear.
- Confirm the devices are powered and connected.
If expected Art-Net devices are missing:
- Close tools that may be using Art-Net port
6454. - Scan again.
- Check the scan warning if StageTools reports that the port is busy.
If the scan finds too much:
- Use Search.
- Filter by tag.
- Hide devices from the current scan if they are not relevant.
- Add blocked IP ranges for ranges that should be skipped.
If Ping Monitor shows a device offline:
- Confirm the device still appears in the scan list.
- Check the cable or wireless path.
- Open the device web interface if available.
- Compare with another device on the same switch or access point.
8.16Network Devices Workflow Example
Use this flow on a new stage:
- Connect to the lighting network, preferably by USB-C Ethernet.
- Run a Quick Scan.
- Add extra subnets if the paperwork lists more than one range.
- Tag consoles, switches, nodes, media servers, and wireless devices.
- Add custom labels for devices you need to recognize quickly.
- Save the scan profile.
- Open Map and arrange the main devices.
- Add connections or import a linked Quick Plot.
- Start Ping Monitor on the critical devices.
- Export a scan report if another department or vendor needs the device list.
Chapter 9DMX Viewer
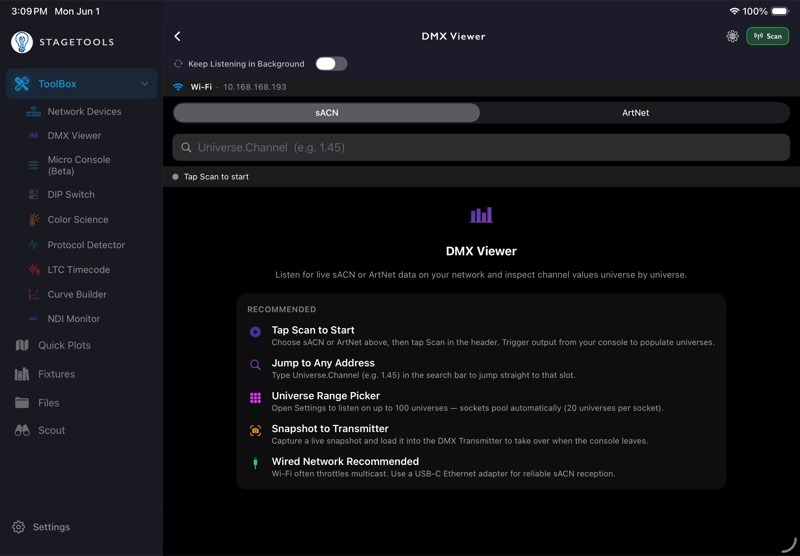
DMX Viewer listens for live sACN or ArtNet data and shows what is arriving on the network. Use it to confirm that a console is outputting, inspect active universes, jump to specific channels, watch changing values, and capture a snapshot into the transmitter workflow.(![]() )
)
DMX Viewer is a listener. It does not transmit DMX by itself.
9.1Open DMX Viewer
- Open ToolBox.
- Tap DMX Viewer.
- Choose sACN or ArtNet.
- Tap Scan.
- Trigger output from the console or source.
StageTools shows a universe row when it receives data inside the selected range.
9.2Choose sACN or ArtNet
DMX Viewer has a protocol picker for sACN and ArtNet.
Use sACN when the source is sending E1.31 data. sACN uses UDP port 5568 and multicast universe joins.
Use ArtNet when the source is sending Art-Net data. ArtNet uses UDP port 6454.
The selected protocol controls the listener, the universe list, settings range, and snapshot source. If you switch protocols, the search field resets so you do not accidentally jump inside the wrong protocol view.

9.3Keep Listening in Background
The Keep Listening in Background toggle controls whether DMX Viewer keeps listening when you leave the page.(![]() )
)
Use it when:
- You are waiting for a console or node to start outputting.
- You need to check another StageTools page without losing the listener.
- You want to keep DMX Viewer available while moving through the app.
Turn it off when you want the listener to stop when you leave DMX Viewer.
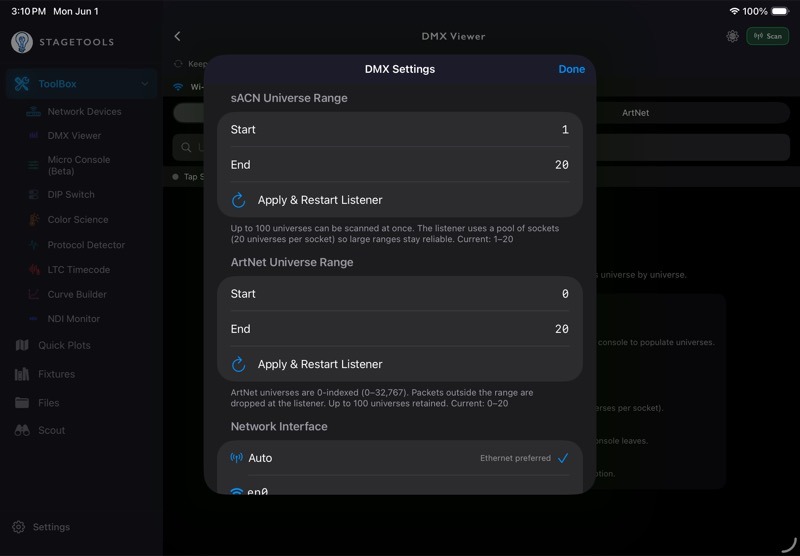
9.4DMX Settings
Open DMX Settings from the settings icon in the DMX Viewer header.
DMX Settings includes:(![]() )
)
- sACN Universe Range.
- ArtNet Universe Range.
- Network Interface.
- Refresh Interfaces.
For sACN, universe ranges start at 1 and can scan up to 100 universes at once. StageTools uses a socket pool for larger ranges, with 20 universes per socket.
For ArtNet, universes are 0-indexed. StageTools accepts ArtNet universes from 0 through 32767, with up to 100 universes retained at once. Packets outside the selected range are dropped by the listener.
Use Auto for the network interface unless you need to force a specific adapter. Auto prefers USB-C Ethernet when it is available because wired networks are more reliable for sACN multicast.
After changing a range, use Apply & Restart Listener so the listener uses the new range.
9.5Read the Universe List
When DMX Viewer receives data, the main list shows active universes for the selected protocol.(![]() )(
)(![]() )(
)(![]() )
)
Each universe row shows:
- Universe number.
- Active channel count.
- A small preview of the first 32 channel values.
Tap a universe to open its full 512-channel grid.
The status bar shows whether the listener is running, the port being used, and how recently the last packet arrived. For sACN, StageTools also shows diagnostic chips for socket count, multicast joins, and packets per second.
9.6Search by Universe and Channel
Use search when you know the address you need to inspect.
- Tap the search field.()
- Enter the address as
Universe.Channel. - Use a period between the universe and channel, such as
1.45. - Submit the search.
If the universe has live data, StageTools opens that universe and highlights the channel. If the universe has not been received yet, the result banner shows that no data is available for that universe.
The same search format works inside a Universe detail page. Searching a different universe from inside the grid opens that universe and highlights the requested channel.
9.7Inspect a Universe
The Universe page shows a 512-channel heatmap grid.
Each channel cell shows:
- Channel number.
- Current DMX value.
- Color based on value and change direction.
- Orange highlight when selected.
- Red highlight when Flicker Finder flags it.
Tap any channel to pin its details at the top of the page. The detail panel shows channel number, DMX value, and percentage.
Channel color indicates recent direction:
- Blue means the value increased.
- Green means the value decreased.
- Purple means the value is steady.
- Grey means the value is
0.
9.8Use Flicker Finder
Flicker Finder helps find channels that changed when the output should have stayed still.(![]() )
)
To use it:(![]() )(
)(![]() )
)
- Open a universe.
- Make sure the output is in the static look you want to test.
- Tap Flicker.
- StageTools takes a snapshot of the current 512 channel values.
- Leave the output still.
- Watch for red flagged channels.
When a channel changes from the snapshot value, StageTools flags it and logs the original value, changed value, and delta.
Flicker Finder has two modes:
- Hold — changed channels stay flagged until you reset or stop Flicker Finder.
- Fade — changed channels stay visible for the selected fade time, then clear from the grid.
In Fade mode, available fade times are 2s, 3s, 5s, and 10s.
Use Reset to take a new snapshot without leaving Flicker Finder. Use the flagged count to open the Flicker Finder Results sheet.
9.9Read Flicker Finder Results
The results sheet lists channels that changed since the snapshot.
Each result shows:
- Channel number.
- Snapshot value.
- Changed value.
- Delta.
If no channel changed, the results sheet shows No Flicker Detected.
Flicker Finder works best when the console output should be static. If a chase, effect, cue fade, or programmer movement is active, the tool will correctly flag those changing channels.
9.10Send a Snapshot to the Transmitter
When DMX Viewer has received live universes, the header shows Send to TX.
Use this when you want to capture current values and load them into the transmitter workflow.(![]() )
)
- Start DMX Viewer and receive live data.
- Tap Send to TX.
- Select up to 4 universes.
- Choose Load Into Transmitter or Save Snapshot as Preset.
Selected universes are copied into the transmitter and marked active. If the transmitter is already running, the copied universes overwrite those values live. Other active transmitter universes remain untouched.
Saving a snapshot preset stores the selected universe values so they can be loaded later from the transmitter preset menu.
9.11Clear DMX Data
Use Clear when you want to remove the received values for the selected protocol.(![]() )
)
- Receive DMX data.
- Tap Clear.
- Confirm Clear DMX Data.
Clearing removes the received universe data. It does not stop the listener. New packets will populate the list again.
9.12DMX Viewer Troubleshooting
If no universes appear:
- Confirm the iPhone or iPad is on the same network as the DMX source.
- Use USB-C Ethernet when possible.
- Confirm the selected protocol is correct.
- Check the universe range in DMX Settings.
- Confirm the console or source is actually outputting.
- For sACN, check whether the network is passing multicast.
If ArtNet does not start:
- Check whether another app or StageTools tool is using UDP port
6454. - Stop the other listener or transmitter.
- Start DMX Viewer again.
If search does not work:
- Use the
Universe.Channelformat. - Confirm the channel is between
1and512. - Confirm the universe has been received inside the selected protocol.
If Flicker Finder flags too much:
- Confirm the console output is static.
- Stop running effects, cue fades, or programmer movement.
- Tap Reset to take a new snapshot.
9.13DMX Viewer Workflow Example
Use this flow when troubleshooting a console output:
- Connect by USB-C Ethernet when possible.
- Open DMX Viewer.
- Choose sACN or ArtNet.
- Set the expected universe range in DMX Settings.
- Tap Scan.
- Confirm the expected universes appear.
- Search for a known address, such as
1.45. - Open the universe and inspect the channel grid.
- Use Flicker Finder if values are changing unexpectedly.
- Use Send to TX only if you intentionally want to capture values into the transmitter workflow.
Chapter 10Protocol Detector
Protocol Detector passively listens for common lighting, control, and show-network protocols. Use it when you need to know what is actually talking on the network before you start changing settings.(![]() )
)
Protocol Detector is receive-only. It listens for traffic and joins known multicast groups, but it does not send control packets to fixtures, consoles, or nodes.
10.1Open Protocol Detector
- Open ToolBox.
- Tap Protocol Detector.
- StageTools starts listening automatically.
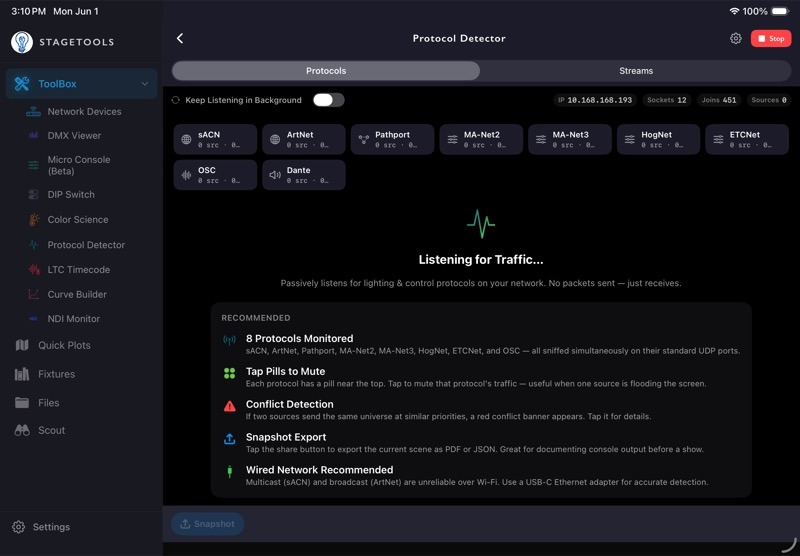
Use a wired USB-C Ethernet adapter whenever possible. Multicast and broadcast traffic can be unreliable over Wi-Fi, especially on busy production networks.
10.2Start or Stop Listening
The scan button in the header starts and stops the detector.
When the detector is running, StageTools listens across supported protocol ports and multicast groups. When it is stopped, the live source list clears.(![]() )
)
Use Keep Listening in Background when:
- You want to leave Protocol Detector and check another part of StageTools.
- You are waiting for a console, node, or media server to come online.
- You want the detector to keep collecting sources while you troubleshoot elsewhere.
Turn it off when you only want Protocol Detector active while the page is open.(![]() )
)
10.3Read the Diagnostics Row
The diagnostics row shows the listener state at a glance:
- IP: the local interface address StageTools is using.
- Sockets: how many UDP sockets are currently bound.
- Joins: how many multicast groups StageTools joined.
- Sources: how many protocol sources are currently active.
If IP shows -, the device may not be connected to a usable show network.

10.4Protocols View
Protocols view groups traffic by protocol. The protocol pills show:
- The protocol name.
- The number of active sources.
- The current packet rate in packets per second.
StageTools currently watches for:
- sACN.
- ArtNet.
- Pathport.
- MA-Net2.
- MA-Net3.
- HogNet.
- ETCNet.
- OSC.
- Dante.
Tap a protocol pill to mute that protocol. Muting is useful when one protocol is filling the screen and you want to focus on the remaining traffic. Tap the pill again to unmute it.(![]() )(
)(![]() )(
)(![]() )(
)(![]() )(
)(![]() )
)
When a protocol is muted, StageTools restarts the listener sockets so the mute choice affects what is actually being tracked.
10.5Read Source Sections
Below the protocol pills, StageTools shows active source sections. Each row represents one source IP for one protocol.
Source rows can show:
- The source IP address.
- The hostname, when one is available.
- Active universes for sACN and ArtNet.
- sACN priority, when detected.
- A small packet-rate sparkline.
- Current packets per second.
Tap a source row to open its detail sheet.
The source detail sheet is useful when you need to confirm whether a console, node, or media server is still actively sending. It shows packet rate, total packets, last seen time, universes, sACN priority, and a larger 60-second packet-rate graph.
10.6Streams View
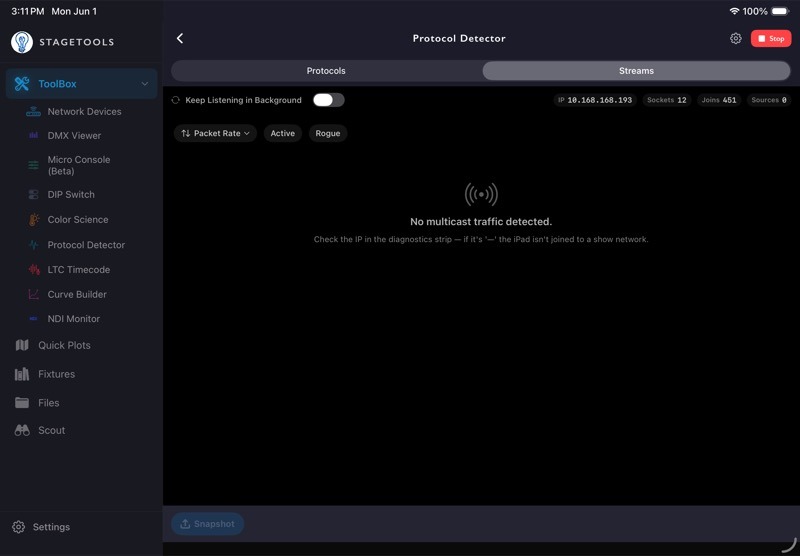
Streams view groups multicast traffic by destination group instead of by protocol source. This helps when the network problem is less about "which console is sending" and more about "what multicast groups are active."
Use Streams view to spot:(![]() )
)
- sACN multicast universes.
- MA-Net multicast groups.
- Dante primary and secondary groups.
- Unknown multicast groups that may not belong on the lighting network.
Each stream group shows:
- A friendly label when StageTools recognizes the group.
- The multicast group address.
- One row per source sending to that group.
- Current packets per second.
- Estimated bandwidth.
- A sparkline for recent packet activity.
10.7Sort and Filter Streams
Streams view includes a sort menu and two filters.
Sort options:(![]() )
)
- Packet Rate: busiest groups first.
- Group Address: multicast groups in address order.
- Last Seen: most recently active groups first.
Filters:
- Active shows only groups with current packet activity.
- Rogue shows only groups StageTools does not recognize.
Use Rogue when something on the network feels noisy or wrong and you want to identify unknown multicast traffic quickly.(![]() )
)
10.8Conflict Detection
If StageTools sees a likely universe conflict, a red conflict banner appears.
Tap the banner to see the conflict details.(![]() )
)
StageTools detects:
- sACN conflicts when two or more sources send the same universe at the same priority.
- ArtNet conflicts when two or more sources send the same ArtNet universe.
For sACN, the conflict sheet shows the universe, priority, source IPs, and a note that HTP collision behavior may apply. For ArtNet, the conflict sheet shows the universe and source IPs, with a note that there is no priority arbitration.
Protocol Detector does not decide which source is "right." It gives you enough evidence to choose what to shut off, repatch, reprioritize, or move to another universe.
10.9Protocol Detector Settings
Open settings from the gear icon in the Protocol Detector header.
The current settings sheet includes HogNet Port.(![]() )
)
HogNet defaults to port 6600. If a Hog 4 or Hog OS console uses a custom HogNet port, enter that port here. Saving rebinds the HogNet socket without restarting the other protocol listeners.
10.10Export a Snapshot
Tap Snapshot at the bottom of Protocol Detector to export the current state.
StageTools creates:(![]() )
)
- A
.jsonsnapshot for structured records. - A
.pdfsnapshot for a readable report.
The snapshot includes:
- Capture time.
- Interface address.
- Socket count.
- Multicast join count.
- Per-protocol source and packet-rate summary.
- Source list.
- Conflicts.
- Stream records, when available.
Use this before a show, before changing console output, or when you need to send a quick network evidence report to another tech.
10.11Protocol Detector Troubleshooting
If no traffic appears:
- Confirm the iPhone or iPad is connected to the show network.
- Prefer wired Ethernet over Wi-Fi.
- Check the IP diagnostic pill.
- Confirm the source device is actually outputting.
- Make sure the protocol is not muted.
- Stop and start Protocol Detector again.
If sACN appears in DMX Viewer but not Protocol Detector:
- Check whether sACN is muted.
- Check whether the device changed networks.
- Leave and reopen Protocol Detector so it rejoins multicast groups.
If Streams view shows unknown traffic:
- Turn on the Rogue filter.
- Note the multicast group and source IP.
- Compare the source IP with Network Devices scan results.
- Export a snapshot before making changes.
If HogNet is missing:
- Confirm the Hog console is on the same network.
- Check whether the console is using the default HogNet port.
- If not, enter the custom port in Protocol Detector Settings.
10.12Protocol Detector Workflow Example
- Connect the iPad to the show network with Ethernet.
- Open Protocol Detector.
- Confirm the IP, Sockets, and Joins diagnostics look active.
- Watch Protocols view for sACN, ArtNet, MA-Net, HogNet, OSC, Dante, or other sources.
- Tap any source you need to inspect.
- Switch to Streams view if multicast traffic looks suspicious.
- Use Rogue to isolate unknown multicast groups.
- Tap the conflict banner if one appears.
- Export a snapshot before changing console or network settings.
Chapter 11Micro Console
Micro Console is StageTools' pocket DMX output tool. Use it to patch fixtures, build fixture-level faders, inspect raw universe values, test fixtures, and transmit sACN or ArtNet when you need temporary control.(![]() )
)
Micro Console can send live DMX to a network. Read the transmit warnings carefully, especially on show networks where another console may already be outputting.
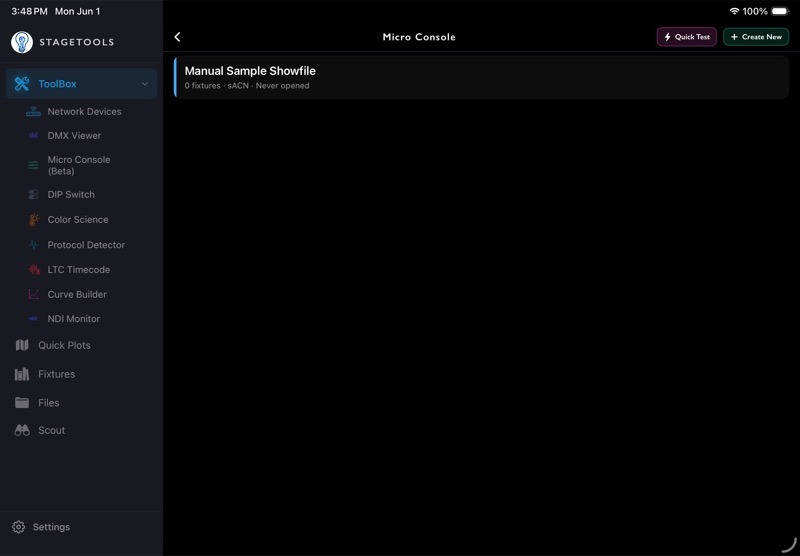
11.1Open Micro Console
- Open ToolBox.
- Tap Micro Console.
- Choose an existing showfile or create a new one.
11.2Understand Showfiles
A showfile stores one Micro Console setup for one production, venue, bench test, or rig.
Each showfile can include:
- Patched fixtures.
- Saved patches.
- Custom fader pages.
- Fixture groups.
- Looks and color palettes.
- Raw grid universes.
- Default transmit settings.
- Notes and a showfile color.
Showfiles sync through iCloud with the rest of StageTools when iCloud Sync is enabled.
11.3Create a Showfile
Tap Create New in the Micro Console header.
Enter:(![]() )
)
- Name: the production, room, fixture test, or rig name.
- Color: a swatch used on the showfile card.
- Notes: optional context for the showfile.
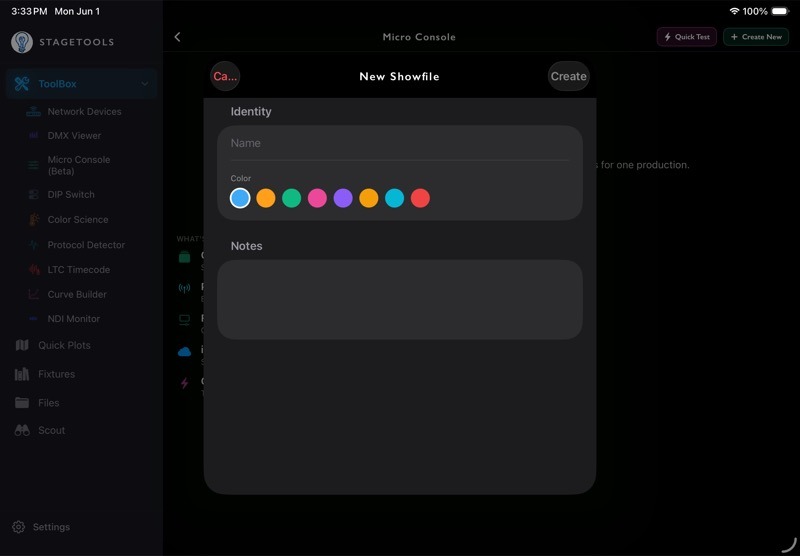
Tap Create to save it.
11.4Manage Showfiles
Showfiles appear as cards. A card shows the showfile name, fixture count, default protocol, universes in use, last opened time, and notes when present.
Swipe a showfile card to:
- Edit the name, color, or notes.
- Duplicate the showfile.
- Delete the showfile.
If a different showfile is currently transmitting, StageTools asks before opening another one because switching showfiles stops the active transmission.
11.5Use Quick Test
Tap Quick Test from the Micro Console showfile browser when you want to test one downloaded GDTF fixture without creating a showfile.
Quick Test opens the fixture tester flow. It is meant for bench checks, fixture profile checks, and quick GDTF verification.(![]() )
)
Quick Test output stops when you leave the sheet. A showfile, by contrast, can keep transmitting until you stop it.
11.6Micro Console Modes
Inside a showfile, Micro Console has four main modes:
- Patch: add, organize, test, and manage fixtures.
- Faders: control fixture attributes and custom fader pages.
- Grid: view and edit raw 512-channel universe data.
- Programmer: work fixture-first with groups, color, position, and beam controls.

Use the mode picker near the top of the showfile to switch modes.
11.7Patch Mode
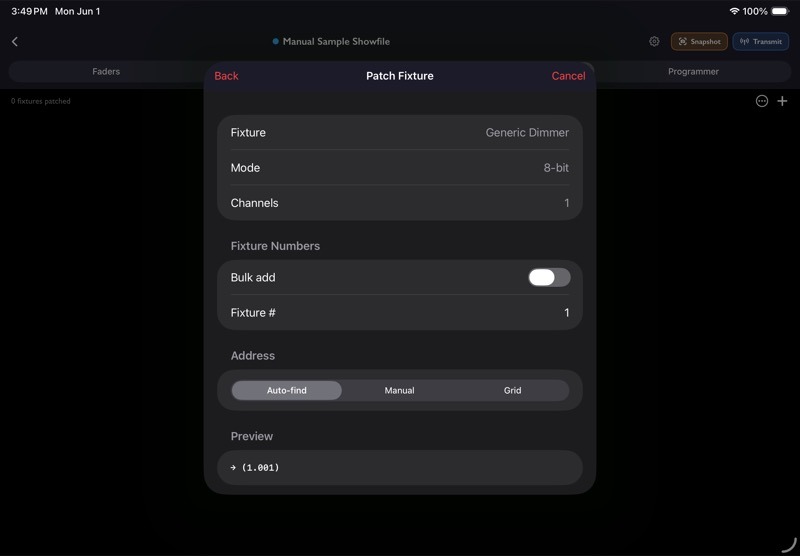
Patch mode is where you add fixtures to a showfile.
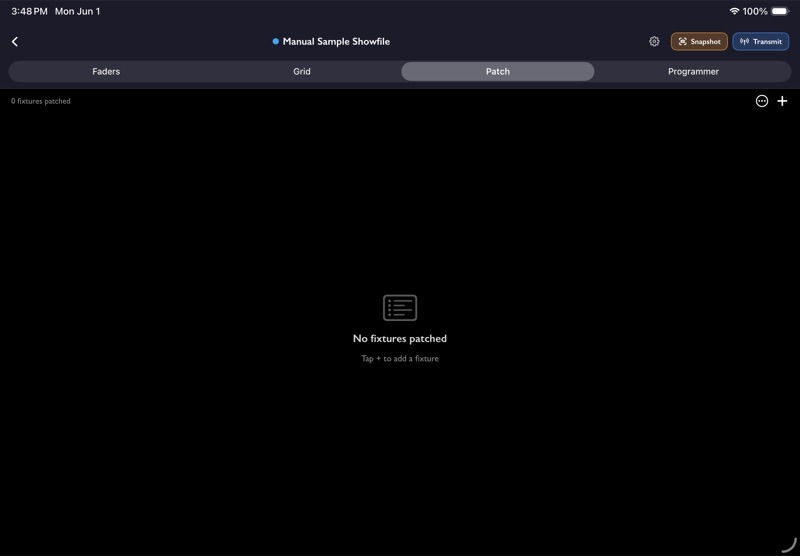
Tap the + button in Patch mode to add a fixture.
StageTools can patch from downloaded GDTF fixtures and generic fixtures.(![]() )
)
When adding fixtures, choose:
- Fixture type or GDTF profile.
- Fixture mode.
- Fixture number or range.
- Universe.
- Start address.
- Address method.
Address methods include:
- Auto-find: StageTools finds the next open address range.
- Manual: you choose the start address.
- Grid: you choose a position visually from the DMX grid.
StageTools checks fixture numbers, address ranges, and overlaps before adding fixtures.
11.8Patch List Controls
When fixtures are patched, Patch mode shows search, filter, sort, and view controls.
Use search to find fixtures by:(![]() )(
)(![]() )
)
- Fixture number.
- Manufacturer.
- Model.
- Mode.
- Note.
Use filters for:
- All fixtures.
- Specific universes.
- Fixtures with pan/tilt.
- Fixtures with color.
- Parked fixtures.
Sort options include universe/address, fixture number, manufacturer, mode, and recently added.
11.9Patch Row Actions
Each patched fixture row shows its fixture number, fixture name, mode, address, and note.
Fixture rows can also show indicators for pan, tilt, parked state, and fixture status.
Use the row menu to:
- Edit the fixture.
- Duplicate the fixture.
- Test the fixture.
- Park or Unpark the fixture.
- Delete the fixture.
Parked fixtures are outlined and do not behave like normal active fixtures. Use parking when you want to keep the fixture in the patch but avoid accidentally controlling it.(![]() )(
)(![]() )(
)(![]() )
)
11.10Save and Load Patches
Open the Patch mode menu to save or load patch layouts.
Use Save Patch when you want to preserve the current patch for later recall.(![]() )(
)(![]() )
)
Use Load Patch when you want to bring back a saved patch layout.
The Patch menu also includes:
- Unpatch Range.
- Label Range.
- Clear Patch.
Clearing the patch removes every patched fixture in the current showfile. Saved patches are not affected.
11.11Patch Grid View
Patch mode can switch between List and Grid.
Grid view shows the DMX universe as a visual 512-channel map. Use it to see address spacing, overlaps, and fixture footprints faster than a list.
In Patch Grid view:
- Tap an empty area to start adding a fixture at that universe/address.
- Tap a fixture block to edit it.
- Use row actions to test, park, unpark, or unpatch fixtures.
- Change universes when the showfile has more than one active universe.
11.12Faders Mode
Faders mode gives you direct fader control for patched fixtures and custom fader pages.
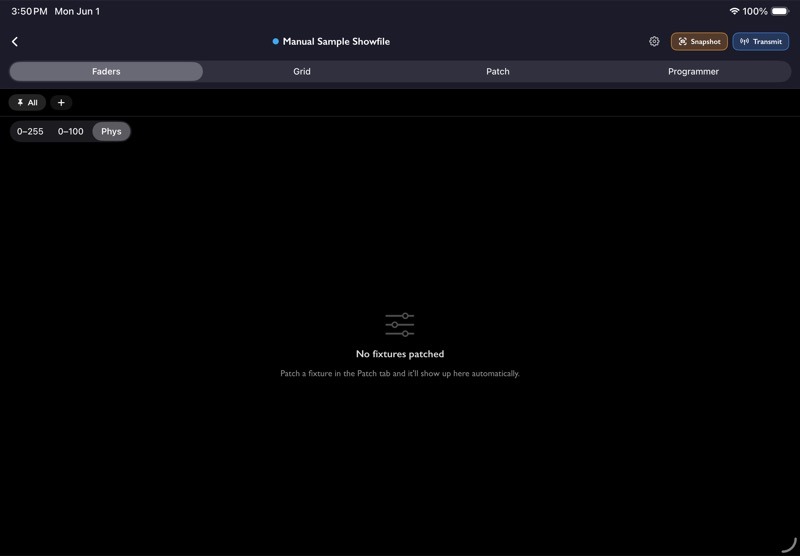
The default fader page shows patched fixtures automatically. Custom pages let you build your own controls.
Fader pages can include:
- Fixture intensity faders.
- Fixture attribute faders.
- Raw channel faders.
Use custom fader pages when you want a focused control surface for a small rig, a test setup, or a repeated troubleshooting workflow.
11.13Custom Fader Pages
In Faders mode, create a custom page when the default fixture list is too broad.
On a custom page, you can:
- Add faders.
- Generate intensity faders.
- Rename the page.
- Delete the page.
- Rename individual faders.
- Type an exact value.
- Delete individual faders.
Custom fader pages are saved inside the showfile.(![]() )(
)(![]() )(
)(![]() )
)
11.14Fader Value Readouts
Faders can display values in different ways:
- 0-255 for raw DMX values.
- 0-100 for percentage values.
- Phys for physical-style readouts when available.
Use the readout mode that matches the task. DMX values are useful for exact channel work; percentages are easier for fixture intensity and quick balancing.
11.15Grid Mode
Grid mode shows raw DMX universe values.
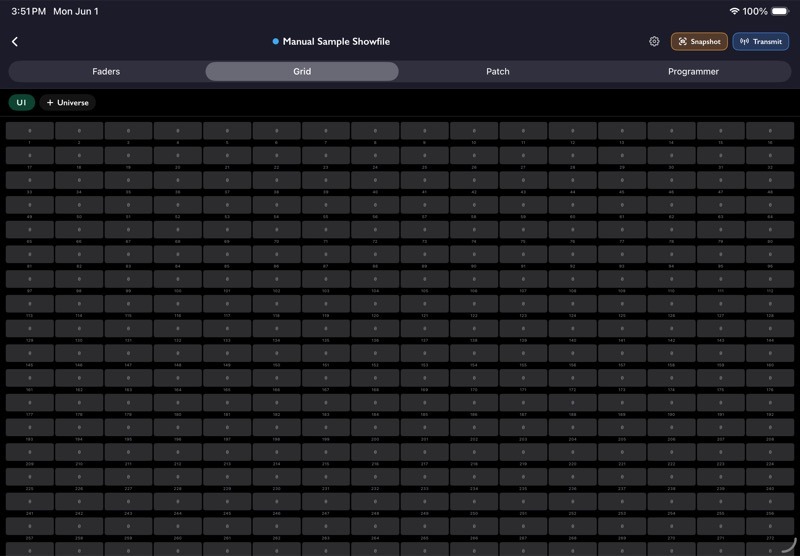
Use Grid mode when:
- You need to see or edit raw channel values.
- You imported a snapshot from DMX Viewer.
- You added a universe that does not yet have patched fixtures.
- You want to confirm what Micro Console is preparing to send.
Tap Add Universe when you need a raw universe available in the grid even before fixtures are patched.
Remove a universe when it is no longer needed.(![]() )
)
11.16Programmer Mode
Programmer mode is the fixture-level control surface. It is organized around selected fixtures and control tabs.(![]() )
)
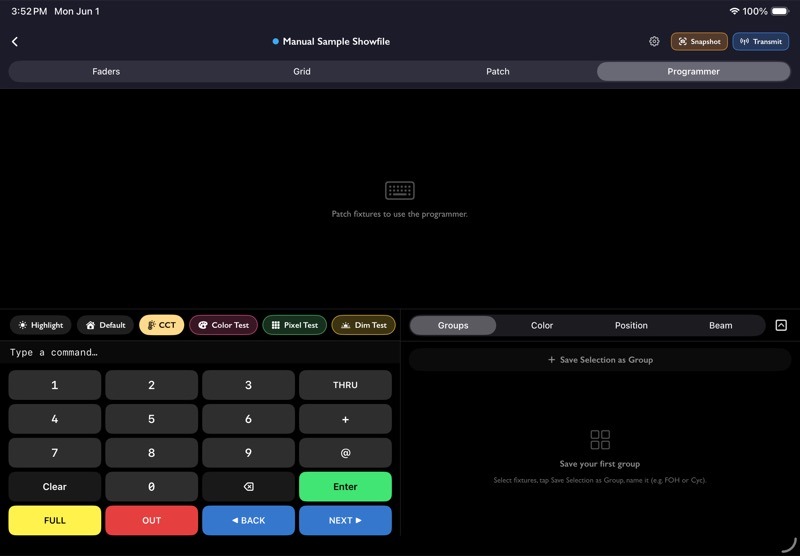
Programmer tabs:
- Groups.
- Color.
- Position.
- Beam.
Patch fixtures first. Programmer controls appear when there are patched fixtures to work with.(![]() )(
)(![]() )(
)(![]() )(
)(![]() )
)
11.17Select Fixtures in Programmer
Programmer mode can work with all fixtures, active fixtures, or selected fixtures depending on the current view and filter.
Use fixture selection when:
- You only want to adjust one fixture.
- You want to control a group of fixtures together.
- You want to make a color, position, or beam change without touching the whole patch.
The number pad supports fixture-style commands such as fixture numbers, THRU, +, @, FULL, OUT, BACK, and NEXT.
11.18Groups Tab
Use Groups to organize fixtures you control together often.

Groups can be used for:
- Fixtures in one area.
- Fixtures of the same type.
- Key lights, practicals, room lights, or set pieces.
- Any temporary selection you need during troubleshooting.
Group actions include adding fixtures to selection, renaming, coloring, and deleting groups.
11.19Color Tab
Use Color to set fixture color using the controls that best match the fixture or the job.(![]() )
)
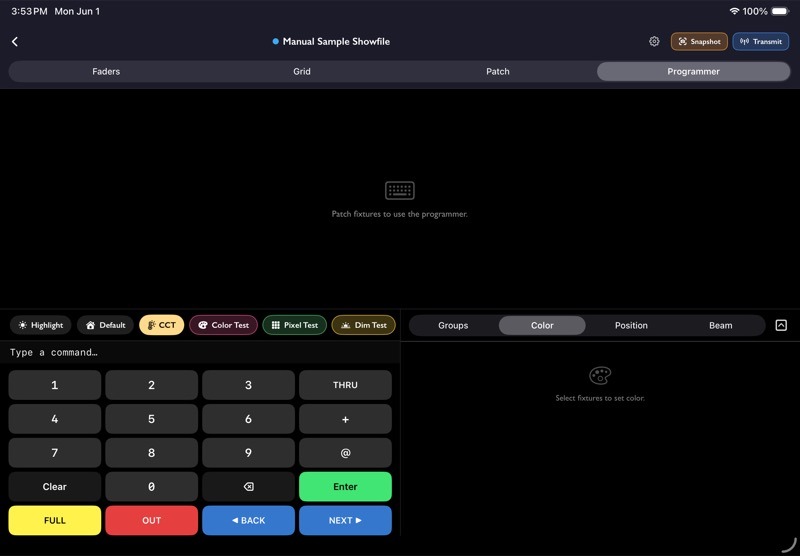
Color modes include:
- Presets.
- HSI.
- CCT.
- RGB.
- CMY.
- CIE.
Color presets can be universal, fixture-type-specific, or selective. This keeps common colors available without forcing every fixture type to use the same channel interpretation.
For CCT work, use Kelvin and tint controls. For LED color mixing, use RGB, CMY, HSI, or CIE depending on what the fixture profile supports.
11.20Position Tab
Use Position for pan and tilt control.
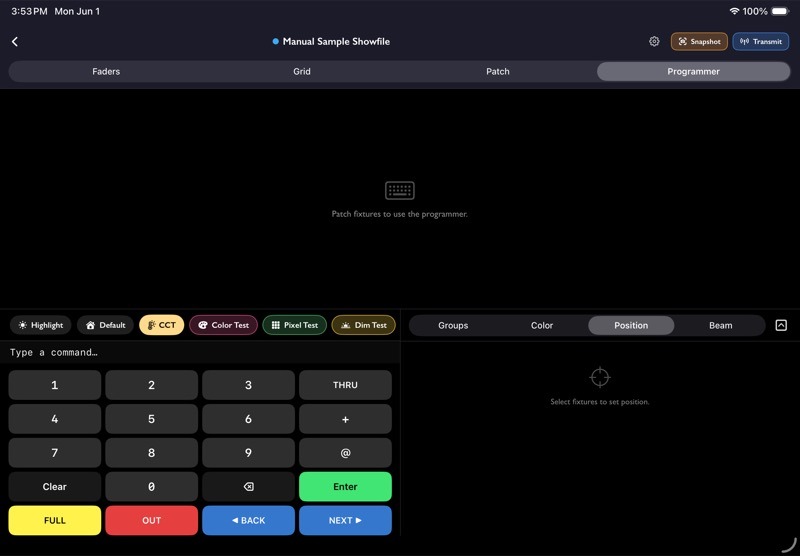
Position controls can include:
- Pan slider.
- Tilt slider.
- Fine movement controls.
- A 2D position pad.
- Next and back selection movement.
Use Position with a small selection first, especially on live rigs. Pan and tilt changes are immediately visible when transmitting.
11.21Beam Tab
Use Beam for common non-color attributes.

Beam controls can include:
- Focus.
- Zoom.
- Iris.
- Strobe.
- Shutter.
Available controls depend on the patched fixture's GDTF profile and selected mode.(![]() )
)
11.22Quick Test Buttons
Programmer mode includes quick test actions for fast fixture checks.
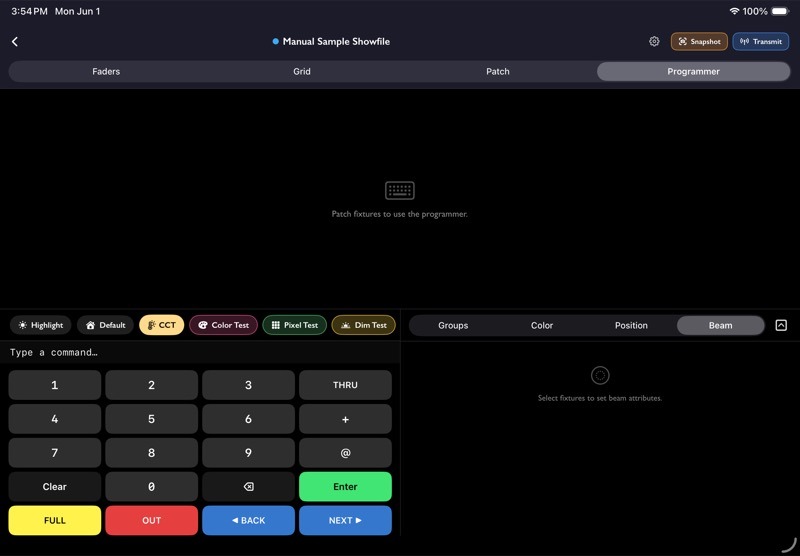
Use quick tests for:
- Highlighting selected fixtures.
- Running a color test.
- Running a pixel test.
- Checking dimmers.
- Blacking out output.
Quick tests temporarily change output and then restore values when stopped where the tool supports restoration.
11.23Snapshot from DMX Viewer
Use Snapshot when you want Micro Console to import live sACN or ArtNet values that DMX Viewer has already seen.
Common use:(![]() )
)
- A console is outputting a look.
- You capture the active universes.
- You import those values into Micro Console.
- Micro Console can hold or inspect the values from the imported universes.
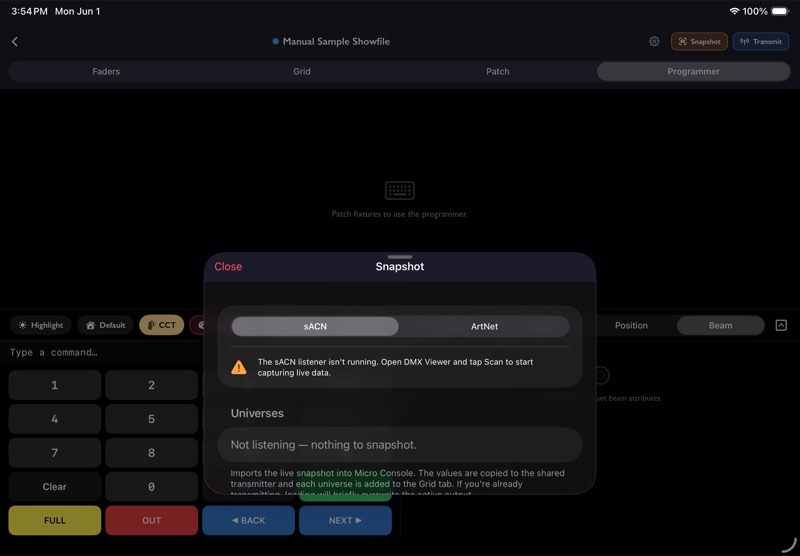
To import a snapshot:
- Open DMX Viewer and start listening.
- Return to Micro Console.
- Tap Snapshot.
- Choose sACN or ArtNet.
- Select the universes to import.
- Tap Import into Micro Console.
Imported universes are copied into the shared transmitter data and added to Grid mode. If Micro Console is already transmitting, StageTools asks before overwriting live output.
11.24Transmit Settings
Tap Transmit to open transmit settings.
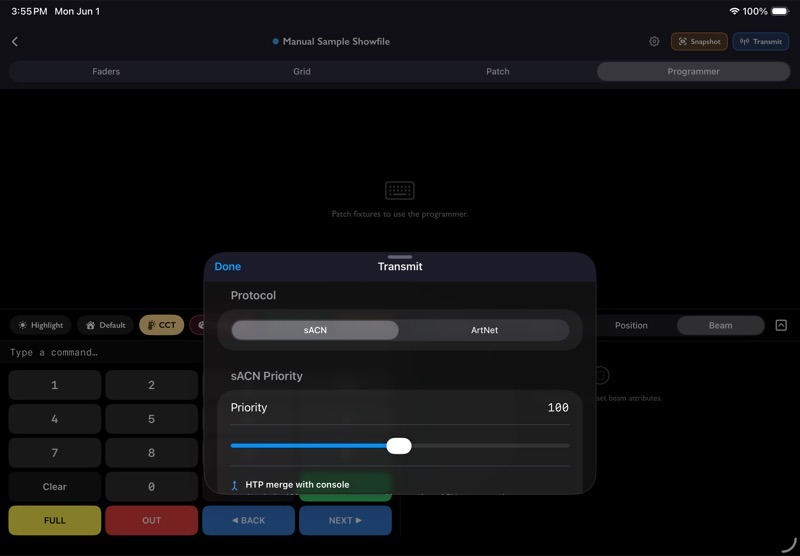
Transmit settings include:(![]() )(
)(![]() )
)
- Protocol: sACN or ArtNet.
- sACN priority.
- Enabled universes.
- Solo Control Mode.
- Start/Stop Transmit.
Only enabled universes are sent on the wire.
11.25sACN Priority
sACN priority affects how receivers choose between sources.
At priority 100, Micro Console is at the normal console priority. If another source is also sending at 100, receivers may merge values using HTP behavior.
Below 100, a normal console at 100 can outrank Micro Console.
Above 100, Micro Console can outrank a normal console. This can take over the rig if the receiver follows sACN priority.
Read the priority warning before starting transmit.
11.26ArtNet Output
ArtNet has no priority or HTP arbitration.(![]() )(
)(![]() )(
)(![]() )
)
If another ArtNet source is sending the same universe, fixtures may jump between streams or respond unpredictably. Use Protocol Detector and DMX Viewer to confirm what else is on the network before transmitting ArtNet on a live rig.
11.27Solo Control Mode
Solo Control Mode loads each fixture's GDTF default values on start.
Use Solo Control Mode only when Micro Console is intended to be the only console on the network. If another source is active, Solo Control Mode can affect output on those universes.
When Solo Control Mode is off, Start sends 0 on every channel. On sACN at priority 100 or below, another source with non-zero HTP values may still win.
11.28Network Traffic Warnings
When the transmit sheet detects another source on the network, StageTools shows a warning with the affected universes.
Treat this warning as a pause point. Confirm whether Micro Console is supposed to take over before starting output.(![]() )
)
11.29Start and Stop Transmitting
To start transmitting:
- Open Transmit.
- Choose sACN or ArtNet.
- For sACN, set priority.
- Enable the universes you want to send.
- Check Solo Control Mode.
- Tap Start Transmit.
- Confirm the safety prompt.
While transmitting, StageTools shows a global transmitting banner so you can return to the active showfile from elsewhere in the app.
To stop transmitting:
- Open Transmit.
- Tap Stop Transmit.
You may also be asked to stop transmitting if you open a different showfile or Quick Test.
11.30Showfile Settings
Use the showfile settings button to edit showfile-level defaults.
Settings can include showfile identity, transmit defaults, Solo Control Mode default, preferred interface, and the default tab.(![]() )
)
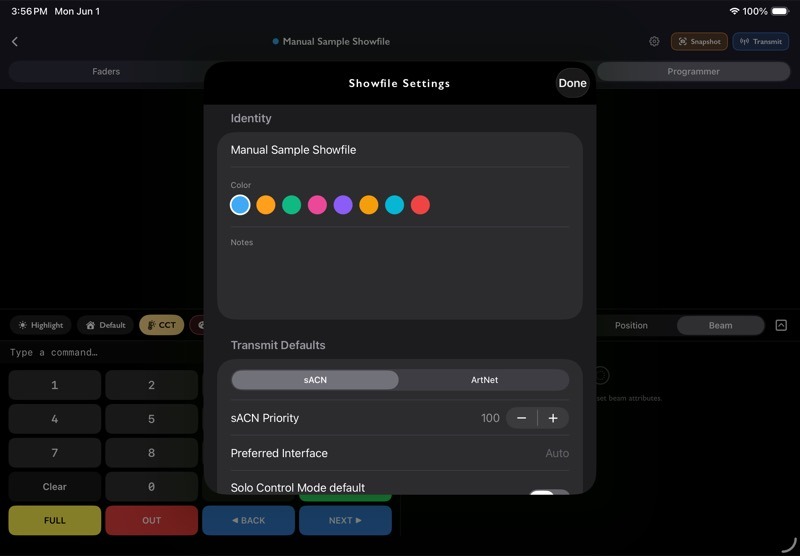
Use defaults to make repeat workflows faster, especially when a showfile always uses the same protocol, priority, or first-open mode.
11.31Micro Console Troubleshooting
If fixtures do not respond:
- Confirm the device is on the same network as the fixtures or nodes.
- Confirm the protocol is correct.
- Confirm the universe is enabled in Transmit Settings.
- Confirm the fixture address and footprint.
- Confirm the fixture is not parked.
- Check whether another source is outranking or conflicting with Micro Console.
If a fixture patch fails:
- Check whether the fixture number is already in use.
- Check whether the address overlaps another fixture.
- Confirm the universe and address are valid.
- Confirm the GDTF fixture is downloaded.
If Snapshot shows no universes:
- Open DMX Viewer.
- Choose the correct protocol.
- Tap Scan.
- Wait for live universe data.
- Return to Micro Console and open Snapshot again.
If transmitting feels risky:
- Stop.
- Open Protocol Detector.
- Confirm what sources are active.
- Open DMX Viewer to inspect live universes.
- Return to Micro Console only when you know what output should happen.
11.32Micro Console Workflow Example
- Create a showfile for the job or fixture test.
- Patch fixtures from downloaded GDTF profiles.
- Use Patch Grid view to confirm universe spacing.
- Build any custom fader pages you need.
- Create groups for common selections.
- Use Programmer to test color, position, and beam attributes.
- Open Transmit Settings.
- Choose protocol, priority, and enabled universes.
- Confirm no unexpected network traffic is present.
- Start transmitting.
- Stop transmitting when the test or temporary control pass is finished.
Chapter 12LTC Timecode
LTC Timecode lets StageTools generate or receive SMPTE LTC over audio. Use it when you need a quick timecode source, need to confirm incoming LTC, or need to check that an audio timecode feed is present.(![]() )
)
LTC uses audio input and output. For frame-accurate work, use wired audio. Bluetooth adds too much latency for dependable timecode.
12.1Open LTC Timecode
- Open ToolBox.
- Tap LTC Timecode.
- Choose Generator or Receiver.

12.2Choose Generator or Receiver
LTC Timecode has two modes:
- Generator sends LTC out through the device audio output.
- Receiver listens for LTC through the device audio input.
Switching modes stops the current LTC engine first. This prevents StageTools from leaving an old input tap or output source running in the background.(![]() )(
)(![]() )
)
12.3Start and Stop LTC
Use the header button to start or stop the selected mode.
When LTC is running, StageTools keeps the audio session active even if you leave the page. Tap Stop when you are done.(![]() )(
)(![]() )
)
12.4Read the Diagnostics Strip
The diagnostics strip shows what the LTC engine is doing.
In Generator mode, it can show:
- TX with the selected frame rate.
- Out with the active output route.
In Receiver mode, it can show:
- RX Listening when StageTools is waiting for valid LTC.
- RX Locked when StageTools is receiving readable timecode.
- In with the active input route.
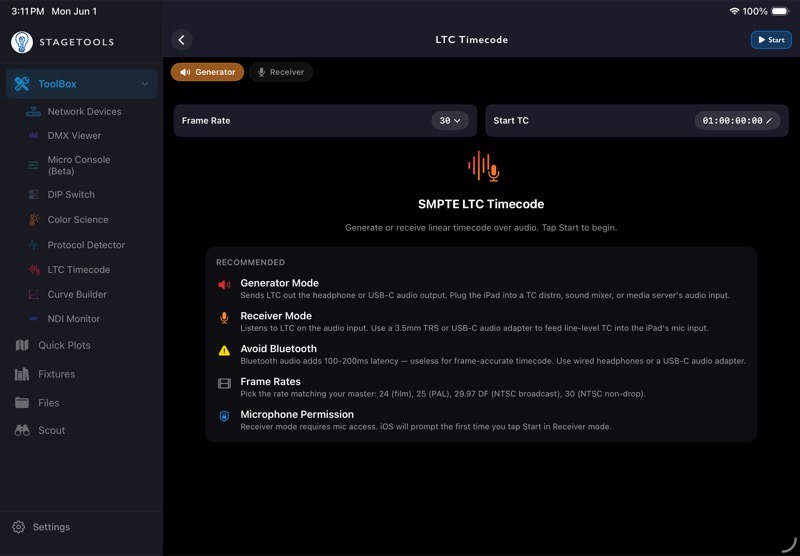
12.5Generator Mode
Generator mode sends LTC from the iPhone or iPad audio output.
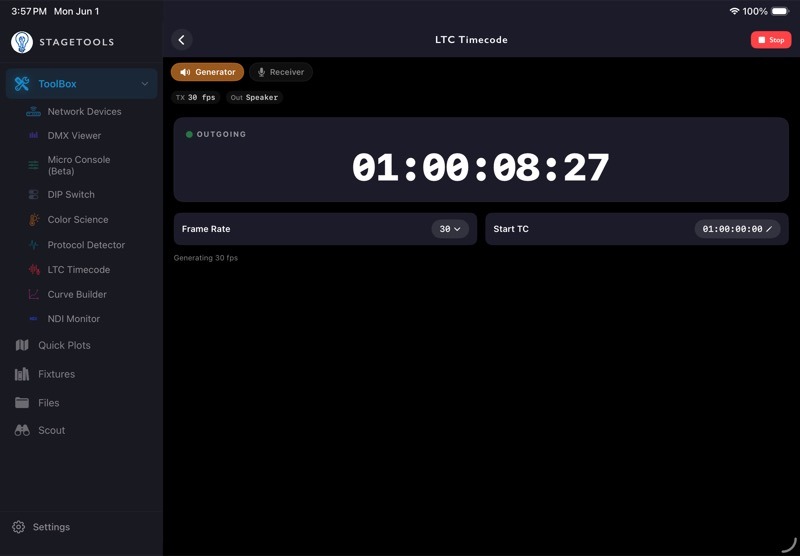
Use Generator mode when:
- You need a portable timecode source.
- You want to feed a timecode distro.
- You want to feed a sound mixer, media server, or camera input.
- You need to bench-check that another device can read LTC.
To generate LTC:
- Choose Generator.
- Set the frame rate.
- Set the start timecode if needed.
- Connect wired audio output.
- Tap Start.
The big timecode display shows OUTGOING while Generator mode is running.
12.6Set Frame Rate
Use Frame Rate to choose the rate that matches the master system.
Available frame rates:(![]() )
)
- 24 for film-style workflows.
- 25 for PAL/EBU workflows.
- 29.97 DF for NTSC drop-frame workflows.
- 30 for NTSC non-drop workflows.
When using 29.97 DF, the display shows a DF badge and uses drop-frame formatting.
12.7Set Start Timecode
In Generator mode, tap Start TC to set the starting timecode.
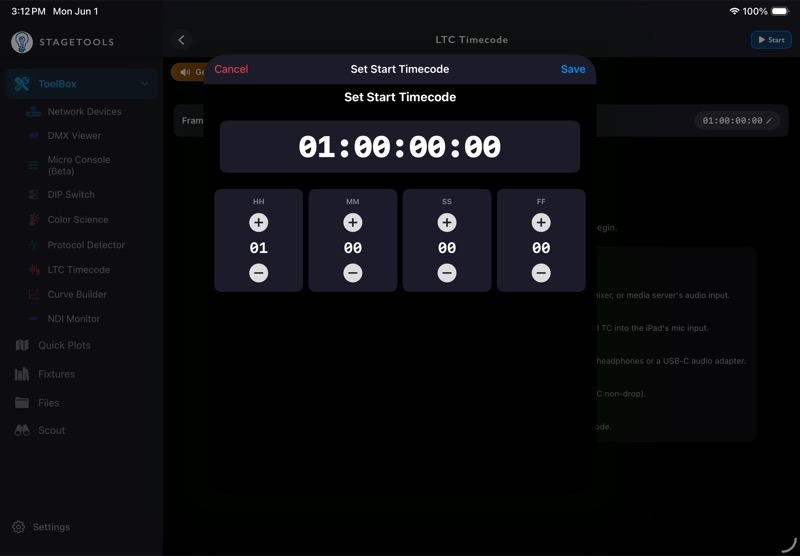
The start timecode editor uses four fields:(![]() )
)
- HH: hours.
- MM: minutes.
- SS: seconds.
- FF: frames.
Tap Save to store the value. The generator uses this value the next time you start Generator mode.
12.8Receiver Mode
Receiver mode listens for incoming LTC through the audio input.
Use Receiver mode when:
- You need to confirm that a timecode feed is present.
- You want to check the incoming timecode value.
- You want to verify frame rate and drop-frame behavior.
- You are troubleshooting an audio timecode line.
To receive LTC:
- Choose Receiver.
- Set the expected frame rate.
- Connect the LTC source to the device audio input.
- Tap Start.
- Watch for RX Locked and the incoming timecode display.
Recommended input path:
- Use a wired USB-C or Lightning audio input adapter.
- Adapt the audio input to a 1/4-inch jack when needed.
- Use a 1/4-inch jack to 3-pin XLR adapter or cable when the LTC source is coming from a standard XLR timecode/audio output.
This is often the cleanest way to get LTC from a mixer, camera, timecode box, or playback rig into the iPhone or iPad without relying on Bluetooth or the built-in microphone.
Receiver mode requires microphone access. iOS asks for permission the first time StageTools starts receiving audio.
12.9Use the Input Level Meter
Receiver mode shows an input level meter while running.(![]() )
)
Use the meter to confirm the LTC signal is reaching the device.
If the meter is too low, the source may be disconnected, muted, or too quiet.
If the meter is pinned, the source may be too hot and distorted.
For the cleanest result, feed the iPhone or iPad through a wired interface or adapter that can accept the LTC source cleanly.
12.10Bluetooth Warning
If StageTools detects Bluetooth output while using Generator mode, it shows a warning.
Bluetooth audio can arrive 100-200 ms late. That is not usable for frame-accurate timecode.(![]() )
)
Use:
- Wired headphones.
- A USB-C audio adapter.
- A proper audio interface.
- A wired connection into the destination device.
12.11Error Messages
If LTC fails to start, StageTools shows an error bar.
Errors usually come from audio route problems, permission problems, or another app holding the audio session.(![]() )
)
12.12LTC Timecode Troubleshooting
If Generator mode does not output:
- Confirm Generator mode is selected.
- Confirm the output route is wired.
- Avoid Bluetooth.
- Confirm the receiving device is listening to the correct input.
- Stop and start LTC again.
If Receiver mode does not lock:
- Confirm Receiver mode is selected.
- Confirm microphone permission is allowed.
- Check the input cable or audio interface.
- Watch the input level meter.
- Match the frame rate to the source.
- Lower the source if the input is distorted.
If the displayed timecode is wrong:
- Confirm the frame rate.
- Confirm whether the source is drop-frame or non-drop.
- Check the source device's timecode settings.
- Stop and restart Receiver mode after changing the expected rate.
If audio elsewhere on the device stops working:
- Return to LTC Timecode.
- Tap Stop.
- Try the other audio app again.
12.13LTC Workflow Example
- Connect a wired audio adapter.
- Open LTC Timecode.
- Choose Generator.
- Set the frame rate.
- Set the start timecode.
- Tap Start.
- Confirm the destination device is receiving.
- Tap Stop when finished.
Chapter 13Curve Builder
Curve Builder helps you measure how a fixture actually responds and turn those measurements into correction curves. Use it for dimmer linearization, color-primary response, fixture reference PDFs, console curve files, and LED-wall color matrix data.(![]() )
)
Curve Builder can transmit DMX directly to the fixture while you take readings. You still need a real meter for the measurement side.
13.1Open Curve Builder
- Open ToolBox.
- Tap Curve Builder.
- Create a new calibration profile or open an existing one.
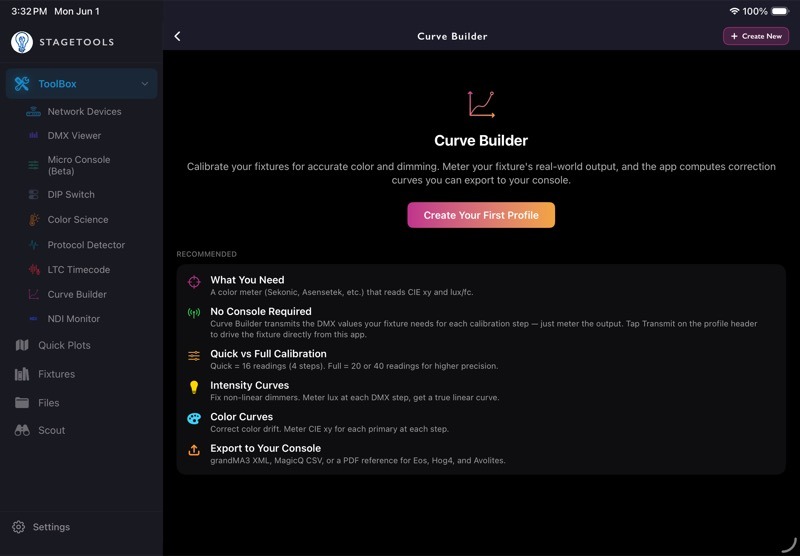
13.2What You Need
For best results, have:
- A color meter or light meter.
- A fixture addressed and connected to the network.
- The fixture's correct DMX mode.
- A wired show-network connection when using Curve Builder to transmit.
- A dark or controlled measurement environment.
For intensity calibration, lux or foot-candle readings are enough.
For color calibration, lux readings build the correction curves. Optional CIE x/y readings unlock chromaticity stability reporting and 3x3 color matrix export.
13.3Create a New Profile
Tap Create New.
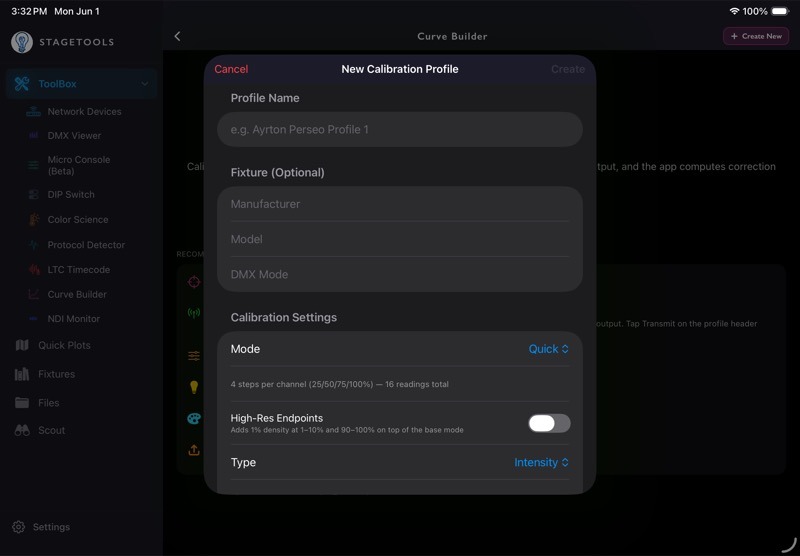
Enter:(![]() )
)
- Profile Name: usually the fixture, mode, and test condition.
- Fixture metadata: manufacturer, model, and DMX mode when helpful.
- Mode: how many measurement steps to create.
- Type: Intensity or Color.
- Color Space for color profiles.
- Target Curve for intensity profiles.
The sheet shows how many readings the profile will require before you create it.
13.4Choose Calibration Mode
Calibration mode controls how many DMX percentages you will measure.
Available modes:
- Quick: 25%, 50%, 75%, and 100%.
- Quick Extended (20%): 20%, 40%, 60%, 80%, and 100%.
- Full (10%): every 10% from 10% to 100%.
- Full (5%): every 5% from 5% to 100%.
Use Quick when you need a fast reference.
Use Full (10%) or Full (5%) when you need a more accurate correction curve.
13.5Use High-Res Endpoints
Turn on High-Res Endpoints when you want extra detail near the bottom and top of the curve.
High-Res Endpoints adds 1% steps from:
- 1-10%.
- 90-100%.
This is useful for LED fixtures that behave strangely near blackout, low glow, or full output.
13.6Choose Intensity or Color
Intensity profiles measure one dimmer-style channel. Use this when the main problem is dimming response.
Color profiles measure RGB or RGBW primaries. Use this when the main problem is color-primary response, color drift, or LED-wall color matching.
For intensity profiles, choose a target curve:
- Linear.
- Exponential.
- Logarithmic.
- S-Curve.
For color profiles, Curve Builder always targets a linear response.
13.7Open a Profile
Profile cards show:
- Profile name.
- Calibration mode.
- Calibration type.
- Target curve or color space.
- Completion count.
- A small curve preview when curves exist.
Tap a profile to open it. Swipe a profile to delete it.
13.8Wizard and Quick Entry
Curve Builder has two reading entry styles:
- Wizard walks you through one reading at a time.
- Quick Entry shows the readings in a list for faster batch entry.

Use Wizard when you are driving the fixture from StageTools and measuring each step in order.
Use Quick Entry when you already have readings written down or want to fill many values quickly.
13.9Set Up DMX Control
Tap Transmit in the profile header to open DMX Control.
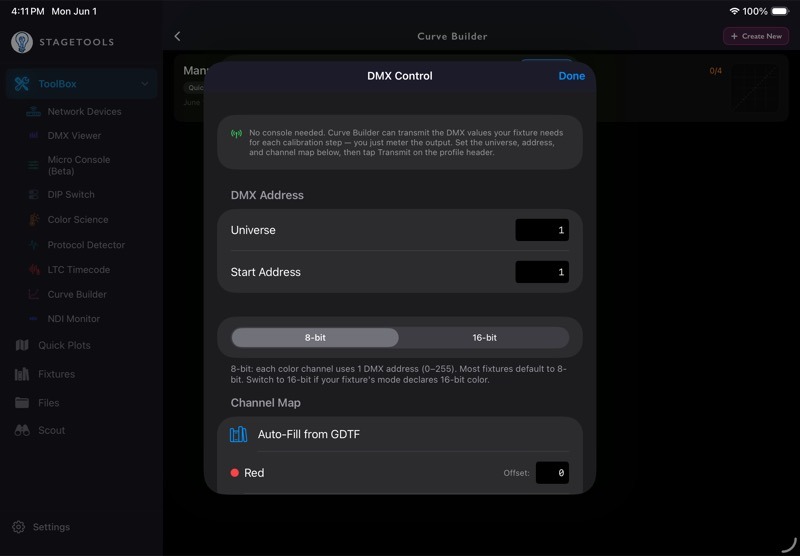
DMX Control lets Curve Builder drive the fixture directly so you do not need a separate console.(![]() )
)
Set:
- Universe.
- Start Address.
- Channel Resolution: 8-bit or 16-bit.
- Channel Map.
- Protocol: sACN or ArtNet.
Then tap Start Transmit.
The transmitter stays on until you tap Stop Transmit.(![]() )(
)(![]() )
)
13.10Use 8-Bit or 16-Bit Channel Resolution
Choose 8-bit when each calibrated channel uses one DMX address.
Choose 16-bit when each calibrated channel uses a coarse/fine pair.
In 16-bit mode, Curve Builder sends the calibration value with full 16-bit precision:
- Coarse byte at the mapped offset.
- Fine byte at the next address.
Use 16-bit only when the fixture mode actually declares 16-bit color or intensity control.
13.11Map Channels
Channel Map tells Curve Builder where each measured channel lives relative to the fixture start address.
For an RGB fixture in 8-bit mode, a common map is:
- Red offset
0. - Green offset
1. - Blue offset
2.
For an RGBW fixture in 16-bit mode, a common map is:
- Red coarse offset
0, fine offset1. - Green coarse offset
2, fine offset3. - Blue coarse offset
4, fine offset5. - White coarse offset
6, fine offset7.
13.12Auto-Fill from GDTF
Tap Auto-Fill from GDTF to use a downloaded fixture profile to fill channel offsets.

Use this when the fixture is already downloaded in Fixtures. If the fixture is not downloaded yet, download it from the Fixture Library first.(![]() )
)
After auto-fill, review the channel map before transmitting. Manufacturer profiles can vary by mode, firmware, and fixture family.
13.13Collect Readings with Wizard
Wizard mode shows the current channel, DMX percentage, DMX value, and reading field.
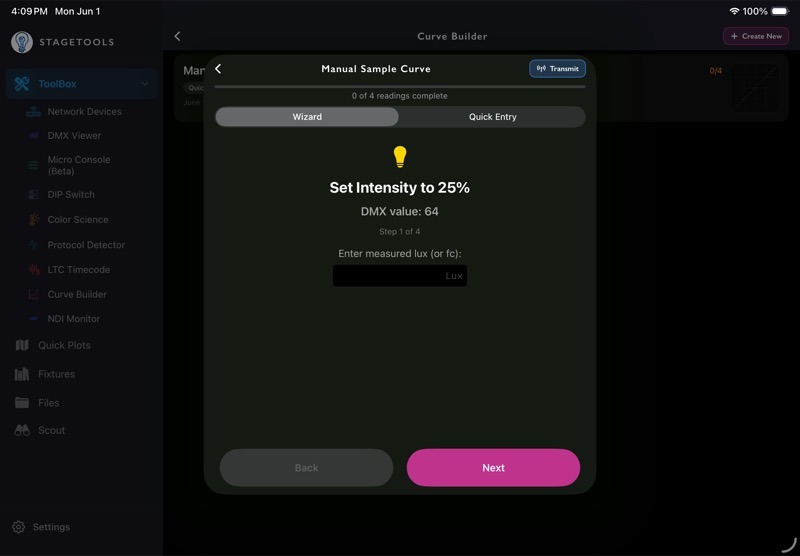
To collect readings:
- Start DMX transmit if you want StageTools to drive the fixture.
- Let the fixture settle.
- Measure the output with your meter.
- Enter lux or foot-candles.
- For color profiles, optionally enter CIE
xandy. - Tap Next.
When DMX control is active, Curve Builder sends the current step value to the fixture and waits briefly so the fixture can stabilize before you enter the measurement.
13.14Enter Color Readings
For color profiles, each primary has its own reading sequence.
For each step:(![]() )
)
- Meter lux or foot-candles.
- Enter the measured value.
- Optionally enter CIE
x. - Optionally enter CIE
y.
Lux values are required for the correction curve.
CIE x/y values are optional, but they are important if you want chromaticity stability diagnostics or a 3x3 color matrix export.
13.15Use Quick Entry
Quick Entry is a list view for entering many readings quickly.
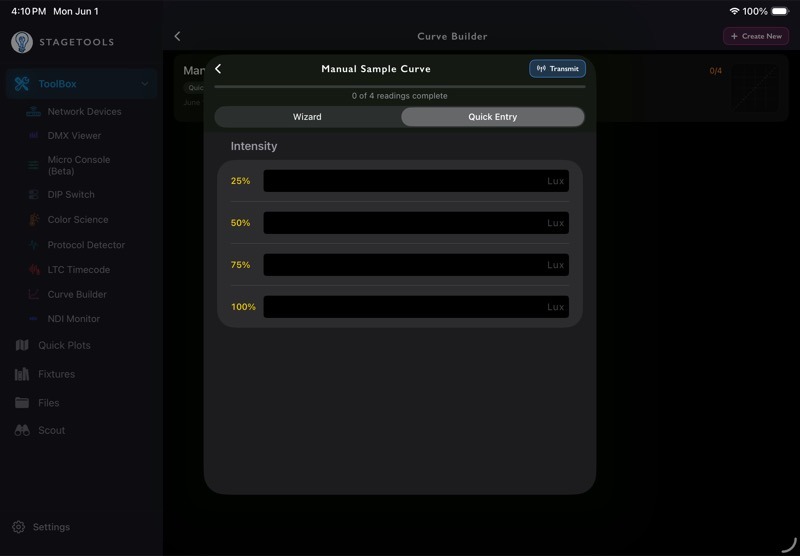
For intensity profiles, Quick Entry shows one section.
For color profiles, Quick Entry groups readings by channel:
- Red.
- Green.
- Blue.
- White, when using RGBW.
Use Quick Entry when you are copying readings from a meter log, spreadsheet, or notebook.
13.16Finish and Review Curves
When all required readings are complete, Curve Builder computes correction curves and opens the finished profile view.
The finished view includes:
- Profile metadata.
- Correction curves.
- Data summary.
- Chromaticity stability, for color profiles with CIE
x/ydata. - Raw readings.
- Expand Data tools.
Tap a raw reading row to edit it.
13.17Read the Curve Graph
The curve graph shows the correction curve over a reference grid.
The dashed diagonal is the uncorrected identity line.
A curve above or below that line means Curve Builder is compensating for how the fixture actually measured.
For intensity profiles, the curve is shown as one intensity curve.
For color profiles, each primary gets its own curve.
13.18Chromaticity Stability
For color profiles, Curve Builder can compare measured CIE x/y values across output levels.
Chromaticity Stability can show:
- Full-output
x/y. - Maximum delta.
- The DMX percentage where the largest drift occurred.
- A verdict such as Excellent, Good, Noticeable, or Poor.
This section only appears with enough CIE x/y data.
13.19Expand Data
Use Expand Data when a profile needs more precision after the first pass.
Expand Data options include:
- Double Resolution: inserts midpoint readings between existing steps.
- Enable High-Res Endpoints: adds 1% density at 1-10% and 90-100%.
- Add Custom Points: lets you add your own DMX percentages.
- Upgrade Mode: adds missing readings for a higher-resolution mode.
Existing readings are preserved. New readings start empty until you meter and enter them.
13.20Export a Profile
Tap the export icon when the profile has computed curves.
Export formats:(![]() )
)
- grandMA3 XML: one XML file per channel.
- ChamSys MagicQ CSV: one CSV file per channel.
- PDF Reference Sheet: readable curve and data reference.
- JSON Profile: StageTools profile data for backup or reuse.
- 3x3 Color Matrix: color correction matrix for supported color profiles.
13.21Export a 3x3 Color Matrix
The 3x3 Color Matrix export appears only when a color profile has the required full-output CIE x/y data for every primary.(![]() )(
)(![]() )(
)(![]() )(
)(![]() )(
)(![]() )
)
When exporting a matrix, choose a target gamut:
- sRGB / Rec.709.
- DCI-P3.
- Rec.2020.
Use this for LED wall or color-processing workflows where you need to map measured fixture primaries into a target color space.
13.22Import and Reuse Profiles
Curve Builder profiles are saved in StageTools and sync with iCloud when iCloud Sync is enabled.
Use JSON export when you want to:
- Back up a calibration profile.
- Move a profile to another device.
- Keep calibration data with a fixture record.
- Share a profile for review.
13.23Curve Builder Troubleshooting
If the fixture does not respond to DMX:
- Confirm the protocol is correct.
- Confirm the device is on the show network.
- Confirm universe and start address.
- Confirm the channel map.
- Confirm 8-bit vs 16-bit mode.
- Check whether another source is controlling the same fixture.
If readings look wrong:
- Let the fixture stabilize before measuring.
- Confirm the meter is aimed consistently.
- Use a controlled environment.
- Confirm the fixture is not receiving extra values from another console.
- Recheck the fixture mode and channel offsets.
If export does not include 3x3 Color Matrix:
- Confirm the profile type is Color.
- Enter CIE
x/yvalues for the required primaries. - Make sure full-output readings include CIE
x/y.
13.24Curve Builder Workflow Example
- Create a new profile.
- Choose Quick, Quick Extended, Full (10%), or Full (5%).
- Choose Intensity or Color.
- Open DMX Control.
- Set universe, address, protocol, resolution, and channel map.
- Start transmit.
- Use Wizard to step through the readings.
- Enter meter values.
- Finish the profile and review the curves.
- Expand data if the first pass needs more precision.
- Export the curve files or PDF reference.
- Stop transmit when finished.
Chapter 14Color Science Calculator
Color Science Calculator helps with two related jobs: quick CCT reference and measured fixture color solving.
The CCT tab is available for quick Kelvin, tint, and color value reference. Fixture Profiles and Solver are for measured fixture workflows, where you record how a real RGB, RGBW, RGBA, RGBWA, or RGBWWCW fixture behaves and then solve toward a target CIE x/y color.
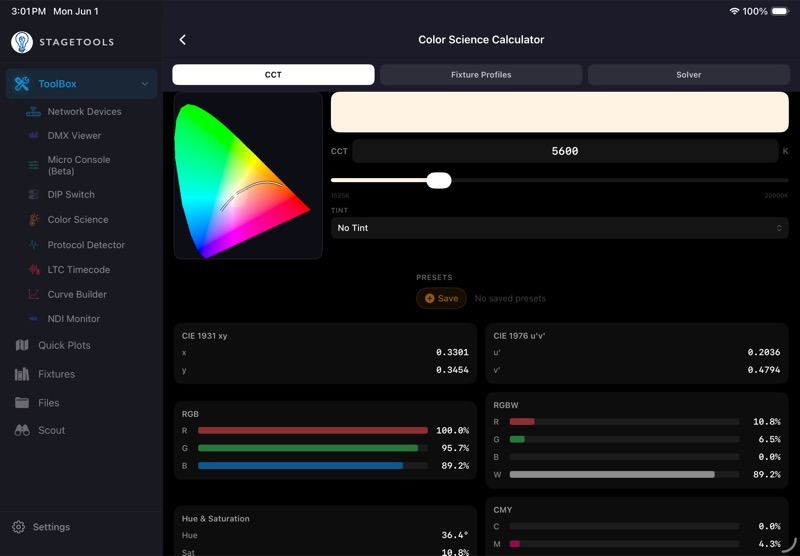
14.1Opening Color Science Calculator
- Open ToolBox.(
 )
) - Tap Color Science Calculator.
- Choose CCT, Fixture Profiles, or Solver from the tab control.
Use CCT when you need a fast color reference. Use Fixture Profiles when you are measuring a specific fixture. Use Solver when you want StageTools to turn a measured CIE target into fixture channel values.
14.2Tabs and Access
Color Science Calculator has three tabs.(![]() )
)
- CCT: free Kelvin/tint conversion and reference values.
- Fixture Profiles: measured fixture profiles for RGB-style fixtures.
- Solver: CIE
x/ytarget solving using completed fixture profiles.
If Fixture Profiles or Solver is locked, StageTools shows an unlock panel. The CCT tab stays available.
14.3CCT Tab
The CCT tab converts a Kelvin value and optional tint into practical color references.(![]() )
)
Use it when you need to:
- Check a color temperature quickly.
- Compare green or magenta tint offsets.
- Convert a target into RGB, RGBW, CMY, Hue/Saturation, CIE
x/y, or CIEu'v'values. - Save common looks as presets.
StageTools uses the ASC White Point Expanded v2 table for Kelvin and tint reference values.
14.4Setting Kelvin
The Kelvin field accepts values from 1525K to 20000K.
- Tap the CCT value field.
- Enter the Kelvin value.
- Or use the slider for faster adjustment.
- Watch the CIE chart and output cards update live.
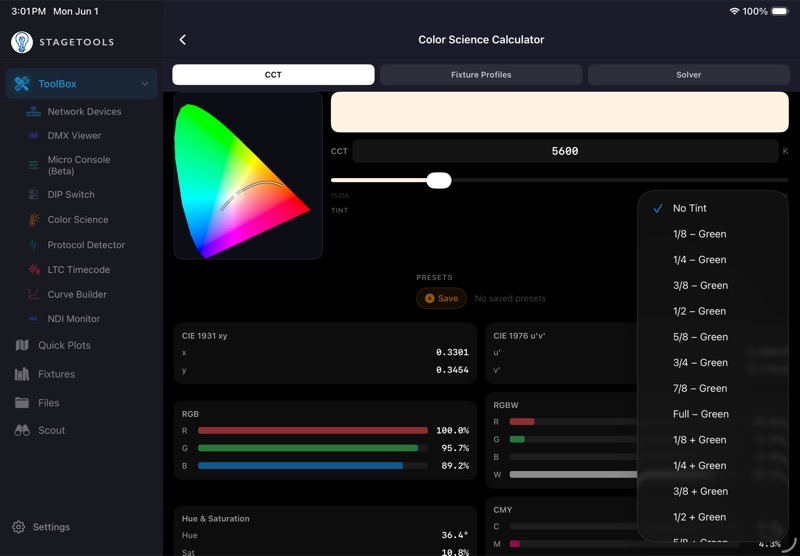
14.5Tint
Tint shifts the target toward green or magenta using the ASC tint table.
- Open the Tint menu.
- Choose the tint level.
- Review the updated output values.
Use tint when the target is not sitting directly on the Planckian locus. For example, this is useful when matching a camera white point, a gel-corrected fixture, or an existing practical source.
14.6CIE Chart and Output Cards
The CIE chart gives a visual reference for where the selected color sits. The output cards give values that are easier to use at the console or in a fixture note.(![]() )
)
Result cards include:
- CIE 1931
x/y. - CIE 1976
u'v'. - RGB.
- RGBW.
- Hue and Saturation.
- CMY.
- Hybrid LED.
Treat these as reference values, not a guarantee that every fixture will match perfectly. Real fixtures vary by emitter set, calibration, lensing, dimmer curve, and manufacturer color engine.
14.7Presets
Presets keep common CCT targets close at hand.
- Set the CCT and tint.
- Tap Save.
- Use the saved preset chip later to return to that target.
- Long-press a preset to delete it.
14.8Hybrid LED
Hybrid LED estimates a warm-white and cool-white mix for two-channel white engines.(![]() )
)
- Set the warm CCT reference for the fixture.
- Set the cool CCT reference for the fixture.
- Choose the target CCT.
- Use the warm/cool percentages as a starting point.
If tint is selected, StageTools shows the CCT reference but cannot force a two-channel warm/cool system to reproduce a green or magenta tint shift by itself.
14.9Fixture Profiles
Fixture Profiles are measured records of how a real fixture behaves. They are the bridge between a theoretical color target and the actual emitters inside a light.
Use Fixture Profiles when you want StageTools to solve for RGB-style channel values instead of relying on generic conversion math.
Supported layouts:
- RGB.
- RGBW.
- RGBA.
- RGBWA.
- RGBWWCW.
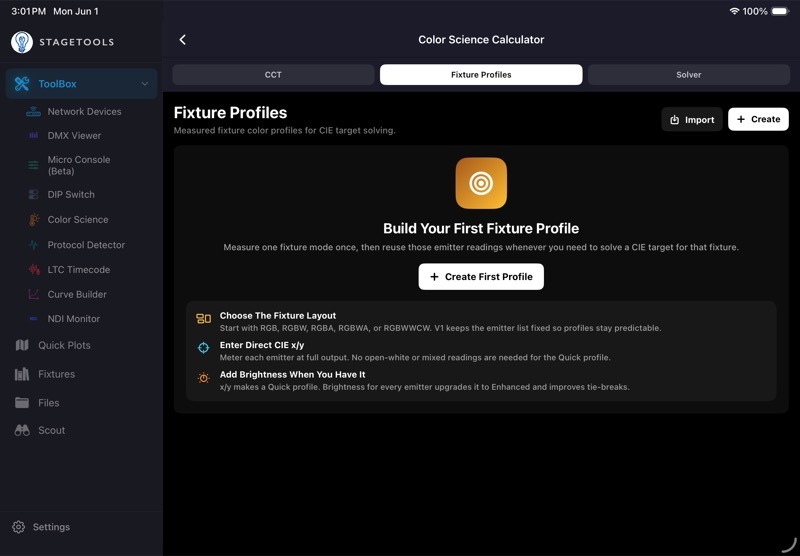
14.10Creating a Fixture Profile
- Open Fixture Profiles.(
 )
) - Tap Create.
- Choose the fixture layout.
- Enter the profile name.
- Add manufacturer, model, and mode/personality when helpful.
- Measure each emitter at full output.
- Enter the CIE
x/yvalues for every emitter. - Save the profile.
The profile appears in Solver after every emitter has a valid direct CIE x/y measurement.
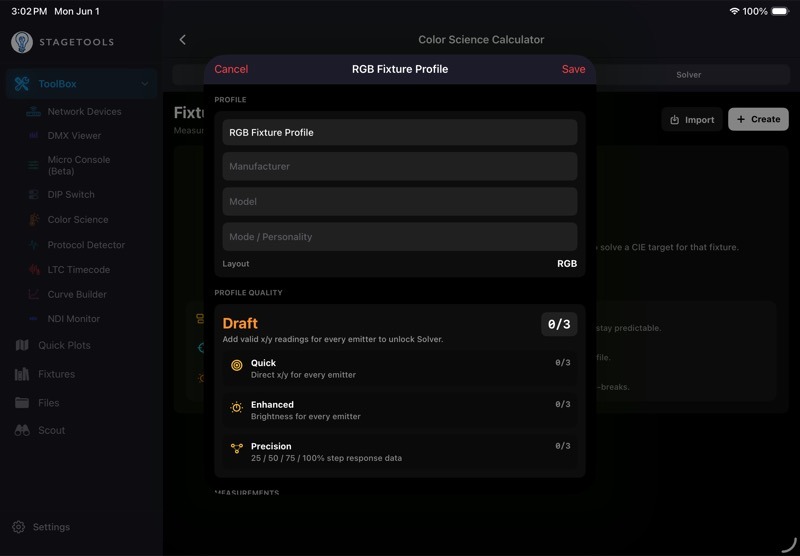
14.11Profile Quality
StageTools labels profiles by how much measurement data they contain.(![]() )
)
- Draft: one or more emitters still need valid CIE
x/yvalues. - Quick: every emitter has direct full-output CIE
x/y. - Enhanced: every emitter has direct CIE
x/yand brightness data. - Precision: every emitter also has measured 25%, 50%, 75%, and 100% step response data.
Quick profiles are enough to start solving chromaticity. Enhanced profiles give the solver better brightness context. Precision profiles let the solver account for nonlinear emitter behavior.
14.12Entering Measurements
For each emitter:
- Set only that emitter to full output.
- Measure the output with a meter.
- Enter CIE
x. - Enter CIE
y. - Add brightness when you have it.
- Repeat for every emitter in the selected layout.
Measure in a controlled setup whenever possible. Keep the meter position consistent, let the fixture stabilize, and confirm that no other console values are affecting the fixture.
14.13Precision Measurements
Precision Measurements are optional step readings.(![]() )(
)(![]() )
)
- Open the profile editor.
- Expand Precision Measurements.
- Measure each emitter at 25%, 50%, 75%, and 100%.
- Enter CIE
x/yand brightness for each step. - Save the profile.
Use this when a fixture does not track linearly through its dimming range, or when you need more confidence in a solve for camera-critical work.
14.14Mixed Checkpoints
Mixed Checkpoints save measured blend samples. They are useful reference points when you want to compare a real fixture mix against the profile data you entered.(![]() )
)
- Open the profile editor.
- Expand Mixed Checkpoints.
- Tap Add Checkpoint.
- Enter the measured result CIE
x/y. - Enter the channel percentages used to create that mix.
- Add brightness if you measured it.
- Save the profile.
Mixed Checkpoints are stored with the profile for validation and future reference. They are not a replacement for measuring the individual emitters first.
14.15Profile Actions
Fixture Profiles can be reused and moved between devices.(![]() )
)
- Import: bring in an exported StageTools color profile JSON file.
- Edit: revise profile details or measurements.
- Duplicate: make a copy before experimenting.
- Export: share or archive the profile as JSON.
- Delete: remove a profile you no longer need.
14.16Solver
Solver turns a measured CIE x/y target into console-ready channel values for a completed Fixture Profile.(![]() )(
)(![]() )(
)(![]() )(
)(![]() )(
)(![]() )
)
Solver works best when:
- The profile matches the exact fixture and mode.
- Every emitter has valid CIE
x/y. - Brightness data is included when available.
- The fixture is measured in the same general setup where the values will be used.
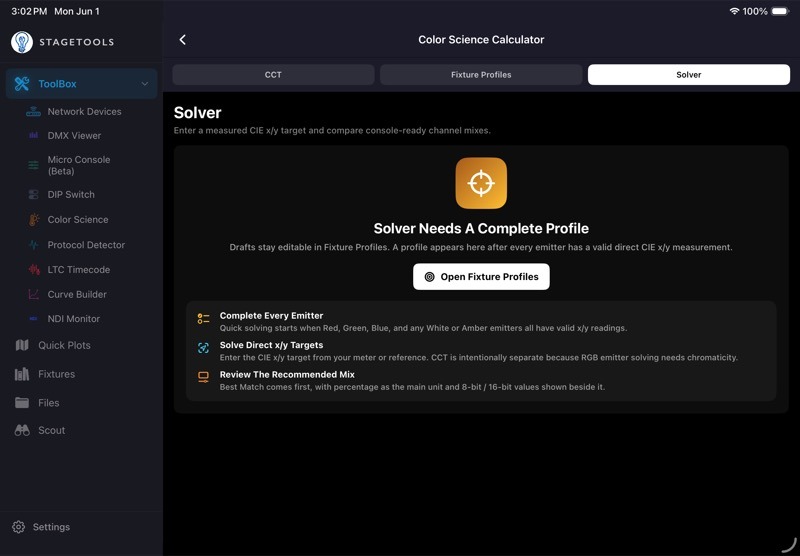
14.17Solving a Target
- Open Solver.
- Choose a complete profile.
- Enter the target CIE
x. - Enter the target CIE
y. - Confirm the active emitters.
- Review Best Match.
- Tap Copy Values if you want to paste the result into notes or another app.
The recommended result shows predicted x/y, Delta u'v', Delta xy, status, and channel values.
14.18Active Emitters
Active Emitters lets you temporarily remove one or more emitters from a solve.(![]() )
)
Use it when:
- You do not want to use a certain color engine.
- An emitter is unavailable or patched differently.
- You want to compare RGB-only against RGBW or RGBWA behavior.
- You need to avoid an emitter that looks bad on camera.
Emitter exclusions apply to the current solve. They do not delete measurements from the profile.
14.19Alternate Mixes
Best Match appears first. Alternate Mixes shows other useful ways to approach the same target.(![]() )
)
Solver strategies include:
- Best Match: closest chromaticity match.
- Use Whites First: favors measured white emitters when available.
- RGB Only: uses Red, Green, and Blue only.
- Maximum Output: prefers brighter mixes when color error is similar.
- Minimum Channels: uses fewer emitters when the match stays close.
- Preserve Brightness: uses measured brightness as a stronger tie-breaker when the profile includes brightness data.
If several strategies land on the same usable recipe, StageTools hides the repeats so the list stays readable.
14.20Reading Solver Values
Each solved channel row shows:
- Percentage.
- 8-bit DMX value.
- 16-bit DMX value.
Use percentage as the main reference when programming by eye or entering fixture color controls. Use 8-bit or 16-bit values when you are matching a DMX table, console value, or exact channel output.
14.21Color Science Troubleshooting
If a profile does not appear in Solver:
- Open Fixture Profiles.
- Confirm every emitter has a valid CIE
x/y. - Check that no value is blank, zero, or outside valid chromaticity range.
- Save the profile again.
If the solve says the target is outside the active emitter range:
- Confirm the target
x/yvalue is correct. - Turn any excluded emitters back on.
- Try Alternate Mixes.
- Remember that some colors cannot be produced by the selected fixture.
If the output does not match on set:
- Confirm the profile matches the exact fixture mode.
- Recheck emitter measurements.
- Add brightness data if the profile is Quick only.
- Add Precision Measurements for fixtures with nonlinear emitter response.
- Confirm no other source is controlling the fixture.
14.22Color Science Workflow Example
- Open Color Science Calculator.
- Use CCT for a quick reference if you only need Kelvin/tint values.
- Open Fixture Profiles for a measured workflow.
- Create a profile for the exact fixture layout.
- Measure each emitter and enter CIE
x/y. - Add brightness readings if available.
- Add Precision Measurements when accuracy matters.
- Open Solver.
- Enter the target CIE
x/y. - Review Best Match.
- Compare Alternate Mixes if needed.
- Copy the values into your notes, plot, or console paperwork.
Chapter 15DIP Switch Calculator
DIP Switch Calculator converts a DMX start address into physical switch positions. It also works in reverse: tap switches on the screen and StageTools recalculates the address.
Use it when you are addressing older dimmers, LED fixtures, practical controllers, wireless receivers, or any device that still uses DIP switches for DMX addressing.
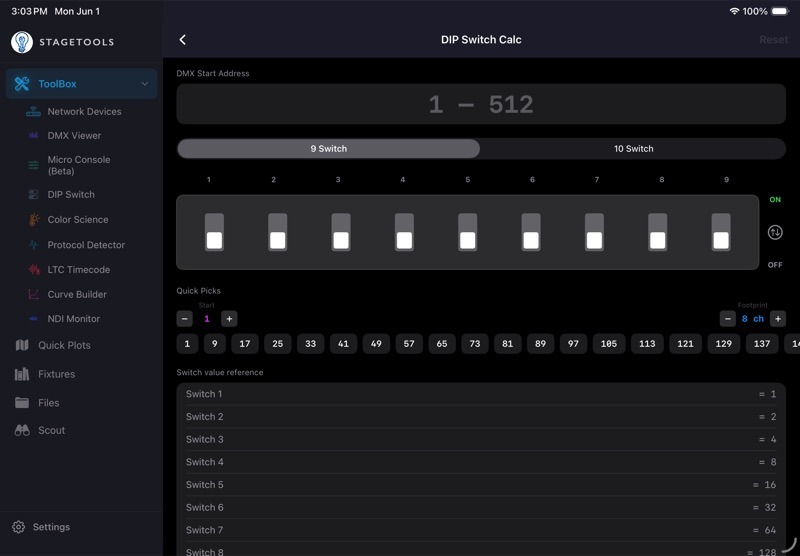
15.1Opening DIP Switch Calculator
- Open ToolBox.(
 )
) - Tap DIP Switch Calculator.
- Enter a DMX start address or tap switches directly.
The header includes Reset. Reset clears the address and turns all switches off.
15.2Entering an Address
- Tap DMX Start Address.
- Enter a value from
1to512. - StageTools turns on the required switches.
- Review the Switches ON chips and binary breakdown.
If the value is outside the valid range, StageTools shows an error and does not calculate a switch pattern.

15.3Copying the Address
When the calculated address is greater than zero, a copy button appears next to the address field.
- Set the address.
- Tap Copy.
- Paste the address into a note, message, label, or other document.
15.4Clearing the Address
Use the clear button beside the address field to empty the current value and turn all switches off.(![]() )
)
Use Reset in the header when you want the same result from the top of the screen.
15.59-Switch and 10-Switch Layouts
DIP Switch Calculator supports 9-switch and 10-switch layouts.(![]() )
)
- 9 Switch uses switches 1 through 9.
- 10 Switch uses switches 1 through 10.
Switch values are:
- Switch 1 = 1.
- Switch 2 = 2.
- Switch 3 = 4.
- Switch 4 = 8.
- Switch 5 = 16.
- Switch 6 = 32.
- Switch 7 = 64.
- Switch 8 = 128.
- Switch 9 = 256.
- Switch 10 = 512.
In 9-switch mode, switch 10 is not part of the active calculation.
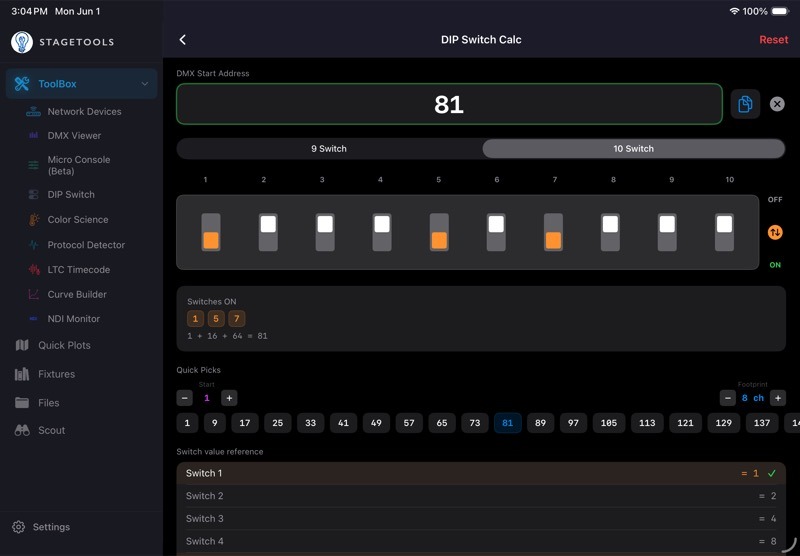
15.6Manual Switch Toggling
You can tap the switch package directly.
- Tap a switch to turn it on.
- Tap it again to turn it off.
- StageTools updates the DMX Start Address field.
- Review the Switches ON chips.
- Use the binary breakdown to confirm the math.
StageTools prevents a switch from turning on if the result would exceed address 512.
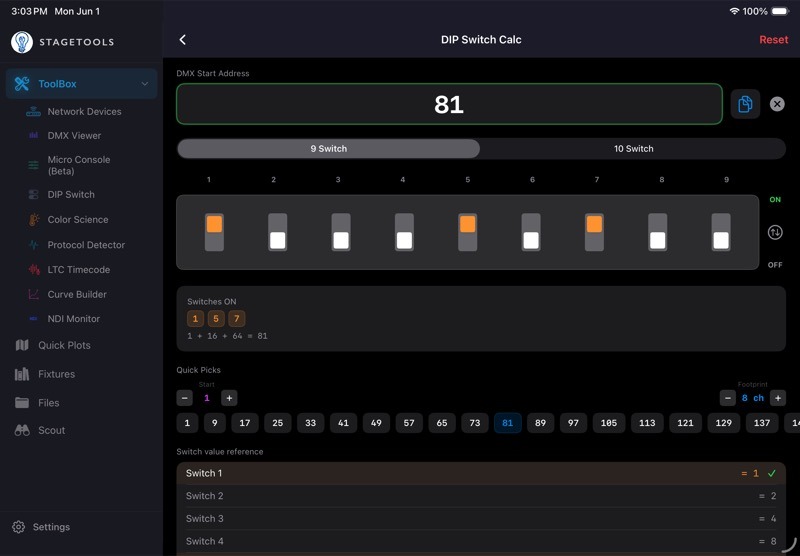
15.7Invert Orientation
Some physical DIP packages label or mount the ON direction opposite of the default on-screen orientation. Invert Orientation flips the visual switch direction without changing the address math.(![]() )
)
- Tap the orientation button between the ON and OFF labels.
- Confirm that the on-screen ON direction matches the physical device.
- Enter or toggle the address normally.
The switch values do not change. Only the visual direction changes.

15.8Quick Picks
Quick Picks generates a row of common start addresses based on a starting address and fixture footprint.(![]() )(
)(![]() )
)
Use it when you are addressing a run of fixtures with the same channel count.
- Set Start to the first address in the run.
- Set Footprint to the number of channels per fixture.
- Tap a generated address.
- StageTools applies that address to the switch package.
For example, a Start of 1 and Footprint of 8 ch creates addresses 1, 9, 17, 25, and so on.

15.9Setting Start and Footprint Directly
The Start and Footprint values can be adjusted one step at a time or entered directly.(![]() )(
)(![]() )
)
- Tap the minus or plus button to nudge the value.
- Tap the Start number to type a starting address.
- Tap the Footprint value to type a channel count.
- Tap Set.
StageTools stores the Quick Picks start address, footprint, and orientation preference so the calculator opens the way you last used it.
15.10Switch Value Reference
The Switch Value Reference lists every active switch and its value. Active switches are highlighted.
Use this section when you want to double-check a physical fixture against the calculated switch positions, especially if the fixture label is worn, sideways, or mounted in an awkward place.
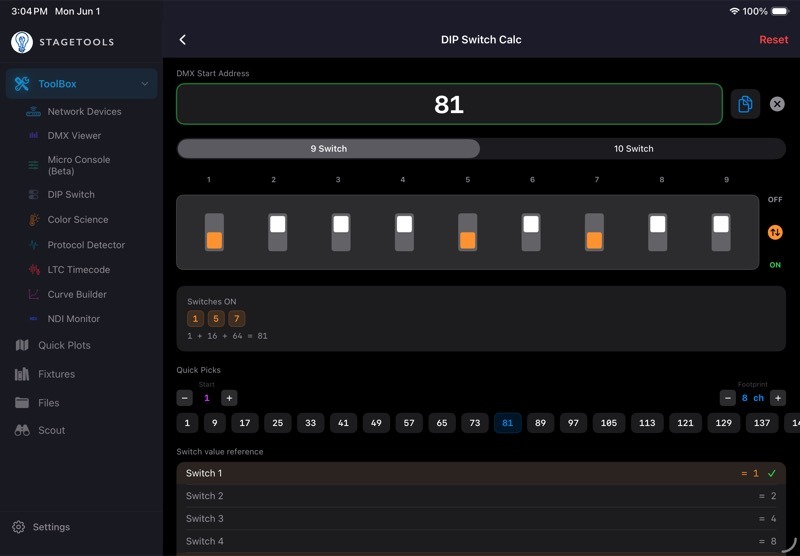
15.11DIP Switch Troubleshooting
If the fixture does not respond at the expected address:
- Confirm the fixture is set to DMX mode.
- Confirm the fixture personality or mode uses the footprint you expected.
- Check whether the fixture uses 9 or 10 DIP switches for addressing.
- Confirm whether the physical ON direction is inverted.
- Verify that the universe and cable path are correct.
- Power-cycle the fixture if its address only updates on boot.
If the physical switch pattern looks backwards:
- Tap the orientation button.
- Match the ON/OFF direction to the fixture label.
- Recheck the Switches ON chips.
15.12DIP Switch Workflow Example
- Open DIP Switch Calculator.
- Choose 9 Switch or 10 Switch.
- Confirm the ON direction matches the physical fixture.
- Enter the start address.
- Set the physical switches shown on screen.
- Use Switches ON and the binary breakdown to double-check the pattern.
- For multiple fixtures, set Start and Footprint in Quick Picks.
- Tap each generated address as you move down the fixture run.
Chapter 16Troubleshooting
Use this chapter when something is not behaving the way you expect and you are not sure which feature chapter to start with.
Start with the simplest checks first: permissions, network connection, selected protocol, selected universe, and whether another source is already controlling the same device or fixture. Most field issues come from one of those five places.
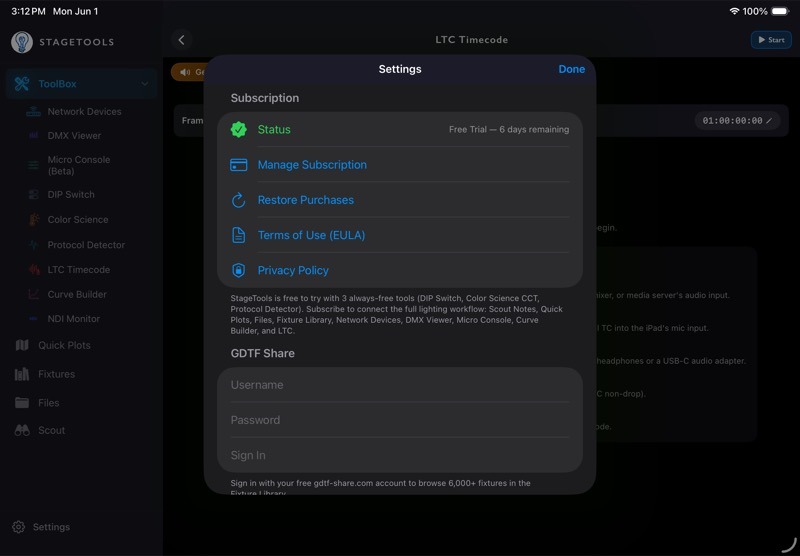
16.1First Checks
Before changing a setup, check these items.(![]() )
)
- Confirm the iPhone or iPad is on the correct Wi-Fi or Ethernet adapter.
- Confirm Local Network permission is enabled for StageTools.
- Confirm the tool is using the expected protocol: sACN or ArtNet.
- Confirm the universe number matches the console, node, or fixture.
- Confirm the device IP range makes sense for the show network.
- Confirm another console, transmitter, or app is not sending conflicting data.
- Restart the specific tool before restarting the app.
- If the device caches settings, power-cycle the device after changing address, mode, or network settings.
If the issue is isolated to one tool, use the tool-specific troubleshooting section first. If it affects multiple tools, start with network and permissions.
16.2Permissions
StageTools needs iOS permissions for some workflows.
- Local Network: required for network scanning, DMX monitoring, DMX transmit, protocol detection, fixture communication, and other LAN workflows.
- Camera: required for QR scanning, Scout photos, and photo capture workflows.
- Microphone: required for Scout voice memos, transcription source recording, and LTC receiver workflows that use audio input.
- Photos or Files access: required when importing, exporting, saving, or sharing media and documents.
- iCloud: required for iCloud-backed sync across devices.
If a permission was denied:
- Open iOS Settings.
- Find StageTools.
- Enable the permission.
- Return to StageTools and retry the workflow.
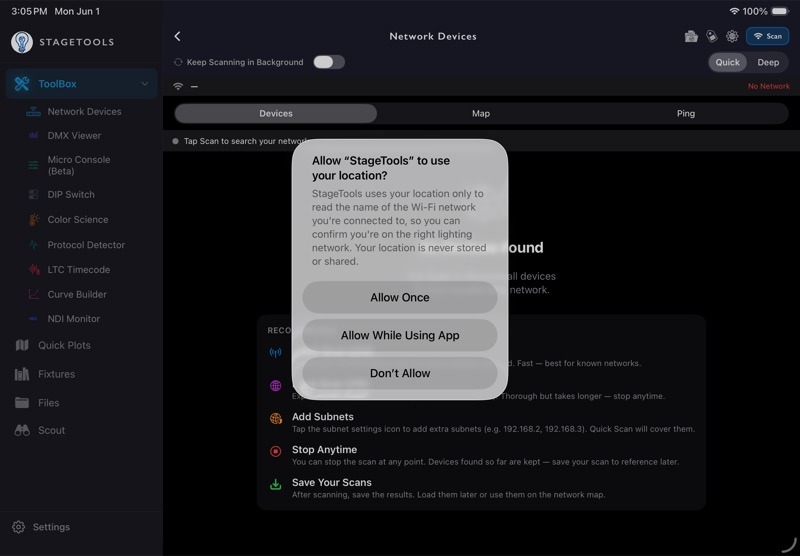
16.3Network Connectivity Issues
If StageTools cannot see devices, receive DMX, or transmit correctly, check the network path.(![]() )
)
- Confirm the device is on the show network, not a guest network or internet-only Wi-Fi.
- If using Ethernet, confirm iOS is actually using the adapter.
- Confirm the adapter, switch, and cable are active.
- Confirm the iPad/iPhone IP address is in the same subnet as the devices you expect to reach, unless the network is intentionally organized across different subnets.
- Confirm the show network is not blocking broadcast or multicast traffic.
- Confirm VPN, private relay, or security software is not interfering.
For sACN, multicast behavior matters. If sACN data does not appear, check the multicast path and universe range. For ArtNet, check broadcast/unicast routing and subnet/net/universe settings on the console or node.

16.4Network Devices Scan Issues
If Network Devices does not find the expected gear:(![]() )
)
- Try Quick Scan first.
- Use Deep Scan when the subnet plan is unclear or the network is organized across different subnets.
- Confirm the scan profile matches the IP range you want to search.
- Confirm the device responds to the kind of scan being used.
- Check whether the device is asleep, booting, firewalled, or on a management VLAN.
- Save known scan profiles for repeated show networks.
If the scan finds too many devices, use search, filters, tags, and favorites before changing the scan range.
16.5DMX Viewer Issues
If DMX Viewer does not show incoming levels:
- Confirm the console or source is actively sending.
- Confirm sACN or ArtNet is selected correctly.
- Confirm the universe range includes the universe you expect.
- Confirm the iPad/iPhone is on the same network path as the source.
- Confirm another network interface is not being preferred.
- If using sACN, check multicast behavior.
- If using ArtNet, check whether the source is broadcasting, unicasting, or sending to a different network range.
If levels appear but look wrong, inspect a single universe and channel range before assuming the whole feed is bad.
16.6Micro Console Transmit Issues
If a fixture or node does not respond to Micro Console:(![]() )
)
- Confirm Transmit is turned on.
- Confirm the protocol is correct.
- Confirm the universe is correct.
- Confirm the patch address and fixture mode match the real fixture.
- Confirm sACN priority is not lower than another active source.
- Confirm Solo Control Mode is set the way you intend.
- Watch for network traffic warnings.
- Stop transmit when you are done testing.
If output appears doubled, stuck, or unexpected, check for another console, snapshot, or network source sending at the same time.

16.7Protocol Detector Issues
If Protocol Detector does not show expected traffic:(![]() )
)
- Confirm the listener is running.
- Confirm the iPad/iPhone is on the same network path.
- Confirm the source is actually transmitting.
- Check whether the traffic is unicast to a different device.
- Check whether multicast traffic is blocked.
- Try a longer listening window.
If Protocol Detector shows conflicts, use the source list and streams view to identify which device is sending the duplicate or unexpected traffic.
16.8Fixture Library and GDTF Issues
If fixture search, download, or GDTF Share sign-in is not working:(![]() )
)
- Confirm the device has internet access.
- Confirm GDTF Share credentials are correct.
- Try search by manufacturer first, then model.
- Check revisions if the expected fixture appears under a different version.
- Use downloaded fixtures for offline work.
- If a downloaded fixture behaves oddly in another tool, confirm the fixture mode/personality.
If a fixture is not in GDTF Share, use another available reference, request the file from the manufacturer, or create the needed notes manually until a proper profile exists.
16.9Quick Plots Issues
If symbols, labels, or drawings are hard to select:(![]() )
)
- Confirm the correct type is active: Lighting, Network/Power, or Grip.
- Confirm the element is on the active layer.
- Confirm the layer is visible and unlocked.
- Zoom in before adjusting dense areas.
- Use nudge for small adjustments.
- Use Free-Move Label Position when the automatic label position is not clear enough.
If a background or export looks wrong:
- Confirm the background image imported correctly.
- Check layer visibility.
- Check whether labels or symbols are hidden behind other items.
- Export again after saving the plot.
16.10Scout Notes Issues
If Scout media, transcripts, or notes are not appearing where expected:(![]() )
)
- Confirm the Scout is saved.
- Confirm Photos, Camera, Microphone, and Files permissions as needed.
- Check the correct Scout section: Photos, Notes, Voice, Files, or PDF export.
- If using transcription, confirm the recording has usable audio.
- Review transcript cleanup before sending text into notes.
- Use Make Scout Notes when you want the strongest AI-assisted note pass.
If Scout media is syncing slowly, open the Scout on the second device and let iCloud finish downloading the media before exporting or presenting it.
16.11Files Issues
If a file, link, or folder is missing:(![]() )
)
- Check the current category or filter.
- Check whether the item is inside a folder.
- Search by name.
- Confirm the file was imported into StageTools, not only previewed from another app.
- Check iCloud Sync if you expect it to appear on another device.
If a link does not open, confirm the URL is valid and the device has internet access.
16.12iCloud Sync Issues
If data does not appear on another device:(![]() )
)
- Confirm both devices are signed into the same Apple ID.
- Confirm iCloud Drive is enabled.
- Confirm StageTools iCloud Sync is enabled.
- Open StageTools on both devices long enough for sync to run.
- Keep large Scout media open long enough to download locally.
- Avoid editing the same item on two devices at the same time.
If sync appears stuck, check iCloud status in Settings, confirm network access, and wait for large media to finish.
16.13App Freezes or Unexpected Behavior
If StageTools freezes or behaves unexpectedly:(![]() )
)
- Leave the tool and reopen it.
- If the issue continues, force quit and reopen StageTools.
- Check whether the issue happens in one file, one Scout, one plot, or across the whole app.
- If it happens in one item, duplicate or export the item before continuing.
- If it happens across the app, restart the device.
- Capture screenshots or screen recordings before changing too much.
When reporting the issue, include what you were doing, what you expected, what happened, the device model, iOS version, and whether the issue repeats.
16.14When to Use Which Tool
Use this table when the symptom could belong to more than one feature.
| Symptom | Start Here | Then Check |
|---|---|---|
| Cannot find devices | Network Devices | iOS Local Network permission, IP/subnet, scan profile |
| DMX levels are missing | DMX Viewer | Protocol, universe range, multicast/broadcast path |
| Fixture is not responding | Micro Console | Patch, universe, address, mode, transmit settings |
| Unknown traffic is on the network | Protocol Detector | Source list, streams view, conflict detection |
| Plot element will not select | Quick Plots | Active type, active layer, lock/visibility |
| Scout media is missing | Scout Notes | Permissions, iCloud media download, Files section |
| Fixture profile is unavailable offline | Fixtures | Downloads, sign-in, internet access |
| Color solve is not available | Color Science Calculator | Complete Fixture Profile measurements |
| DIP pattern looks backwards | DIP Switch Calculator | Invert Orientation |
16.15Support Checklist
Before sending a support report, gather:
- Device model.
- iOS version.
- StageTools version.
- Feature or tool where the issue happened.
- Steps to reproduce the issue.
- Screenshot or screen recording.
- Exported file, plot, Scout, scan report, or profile if the issue is tied to a specific item.
- Network protocol, universe, IP range, and fixture mode when relevant.
Keep the report specific. “DMX Viewer does not show sACN universe 12 from an ETC console on 10.101.1.x after Local Network permission is enabled” is much easier to fix than “networking is broken.”
Chapter 17Next Chapters to Draft
Recommended order:
- Appendix cleanup.
- Screenshot and icon production pass.
Chapter 18Change Log
- June 1, 2026 — Added first-pass Protocol Detector chapter.
- June 1, 2026 — Added first-pass DMX Viewer chapter.
- June 1, 2026 — Added first-pass Micro Console chapter.
- June 1, 2026 — Added first-pass LTC Timecode chapter.
- June 1, 2026 — Added first-pass Curve Builder chapter.
- June 1, 2026 — Added first-pass Network Devices chapter.
- June 1, 2026 — Added first-pass Fixtures chapter and expanded fixture screenshot targets.
- May 25, 2026 — Created first working draft with Quick Start, ToolBox overview, and Quick Plots chapter pattern. Added first-pass Scout Notes and Files chapters.